For Week Ending June 13, 2020
New unemployment insurance weekly claims declined again this week, coming in at a little over 1.5 million claims. This is down substantially from more than 6 million claims posted per week in late March and early April but still higher than pre-COVID- 19 levels. Nearly 21 million Americans remain unemployed, up from just 1.7 million a year ago. As businesses continue to reopen, new unemployment claims and total unemployed is expected to decline in the coming weeks.
In the Twin Cities region, for the week ending June 13:
- New Listings decreased 22.0% to 1,648
- Pending Sales decreased 8.5% to 1,414
- Inventory decreased 20.7% to 9,901
For the month of May:
- Median Sales Price increased 3.3% to $294,375
- Days on Market decreased 8.9% to 41
- Percent of Original List Price Received decreased 0.4% to 99.6%
- Months Supply of Homes For Sale decreased 16.0% to 2.1
All comparisons are to 2019
Click here for the full Weekly Market Activity Report. From MAAR Market Data News.
Market activity up in May from previous month, but down from 2019
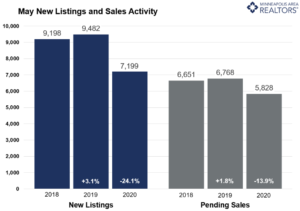
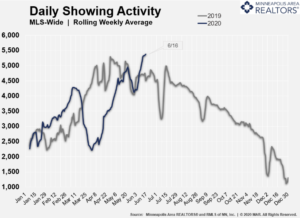
(June 18, 2020) – According to new data from the Minneapolis Area REALTORS® and the Saint Paul Area Association of REALTORS®, market activity was down from last May but increased from this April.The number of residential showings has reached a new high for the year. The decline in pending sales was about half that of new listings, as buyers were motivated by record-low mortgage rates. Pending sales were down just 2.5 percent in the $350-500K price range but fell 34.8 percent on homes between $750K-1M. For new listings, the reverse was true with the biggest declines in the affordable price range of $150-190K and the smallest drop in new listings for homes over $1M.

“Activity is moving through the system—fewer April contracts now means fewer closed sales in May,” said Linda Rogers, President of Minneapolis Area REALTORS®. “But smaller declines in May contracts combined with strong showing activity are reasons for cautious optimism.”Home prices rose to about $295K compared to last May, but it was the smallest percentage gain since January 2017. April was the first month on record where the median home price surpassed $300K. Homes also sold more quickly this May than last, as motivated buyers remained committed, but less serious buyers and “lookers” were not as active. The share of their list price that sellers received declined to 99.6 percent from 100.0 percent last May.
“We expected May to be a slight improvement from April and so far that is mostly true,” said Patrick Ruble, President of the St. Paul Area Association of REALTORS®. “Not only is showing activity displaying some strength, but the home buyers and sellers we work with are starting to feel more confident as well. Rates are at historic lows and should remain low throughout the year.”

Showing activity rose by 11.0 percent from the most recent week compared to the week prior and has reached new highs. The economic toll impacted market segments differently. First-time buyers are more likely to be impacted by job losses in the leisure, hospitality or retail space, while those shopping in the luxury brackets may be impacted by turmoil in equity and energy markets. The middle-market ranges are outperforming, helped along by professionals who can work from home. Given the lack of supply—especially close to the core cities—and price points in the low $400s, the new home market is more stable than the existing resale market.
Mortgage rates on a 30-year fixed loan are around 3.25 percent—the lowest they have ever been. While recessions can pause market activity, they typically only have a minor impact on home prices. A persistently undersupplied market—particularly for affordable homes—may help prices stay afloat.
May 2020 by the numbers compared to a year ago
- Sellers listed 7,199 properties on the market, a 24.1 percent decrease from last May
- Buyers signed 5,828 purchase agreements, down 13.9 percent (4,728 closed sales, down 22.4 percent)
- Inventory levels declined 20.3 percent to 9,744 units
- Months Supply of Inventory was down 20.0 percent to0 months (5-6 months is balanced)
- The Median Sales Price rose 3.5 percent to $294,900
- Cumulative Days on Market decreased 8.9 percent to 41 days, on average (median of 16)
- Changes in Sales activity varied by market segment
- Single family sales fell 9.2 percent; condo sales were down 38.6 percent; townhome sales declined 18.4 percent
- Traditional sales decreased 13.2 percent; foreclosure sales dropped 4.3 percent; short sales fell 30.8 percent
- Previously owned sales were down 13.8 percent; new construction sales declined 0.5 percent
Weekly Market Report

For Week Ending June 6, 2020
Continued low mortgage rates have boosted mortgage applications from prospective home buyers. The Mortgage Bankers Association reported that mortgage applications to purchase a home rose 5% last week, which is 18% higher than applications a year ago. Mortgage applications were down as much as 35% from a year prior just six weeks ago, showing an incredible rebound from the impact of COVID-19.
In the Twin Cities region, for the week ending June 6:
- New Listings decreased 25.0% to 1,674
- Pending Sales decreased 5.6% to 1,418
- Inventory decreased 18.0% to 9,869
For the month of May:
- Median Sales Price increased 3.2% to $294,250
- Days on Market decreased 8.9% to 41
- Percent of Original List Price Received decreased 0.4% to 99.6%
- Months Supply of Homes For Sale decreased 20.0% to 2.0
All comparisons are to 2019
Click here for the full Weekly Market Activity Report. From MAAR Market Data News.
Weekly Market Report

For Week Ending May 30, 2020
Buyer activity continues to improve as states and localities slowly open up. ShowingTime is reporting that nationally, showing activity has been climbing since mid-April and is now at or above the same time last year. This increase in buyer showings predicts continued improvement in pending and closed sales numbers in the weeks to come.
In the Twin Cities region, for the week ending May 30:
- New Listings decreased 27.8% to 1,406
- Pending Sales decreased 10.7% to 1,246
- Inventory decreased 16.4% to 9,935
For the month of April:
- Median Sales Price increased 8.9% to $305,000
- Days on Market decreased 17.5% to 47
- Percent of Original List Price Received increased 0.5% to 99.9%
- Months Supply of Homes For Sale decreased 9.1% to 2.0
All comparisons are to 2019
Click here for the full Weekly Market Activity Report. From MAAR Market Data News.
Weekly Market Report

For Week Ending May 23, 2020
Mortgage rates have now been below 3.30 percent for four consecutive weeks, according to the latest update from Freddie Mac. These near-record low rates have been a catalyst for the recovering buyer activity in the housing market while sellers continue to maintain a little more cautious approach.
In the Twin Cities region, for the week ending May 23:
- New Listings decreased 11.7% to 1,668
- Pending Sales decreased 11.0% to 1,453
- Inventory decreased 17.1% to 9,764
For the month of April:
- Median Sales Price increased 8.9% to $305,000
- Days on Market decreased 17.5% to 47
- Percent of Original List Price Received increased 0.5% to 99.9%
- Months Supply of Homes For Sale decreased 9.1% to 2.0
All comparisons are to 2019
Click here for the full Weekly Market Activity Report. From MAAR Market Data News.
Weekly Market Report

For Week Ending May 16, 2020
More than 4.1 million homeowners are now in mortgage forbearance plans, according to the Mortgage Bankers Association’s latest survey. Homeowners affected by COVID-19 with a federally backed home loan can delay mortgage payments for up to a year as part of the CARES Act passed by Congress. While the latest numbers are an increase from last week, it was the smallest increase since March 10th.
In the Twin Cities region, for the week ending May 16:
- New Listings decreased 27.5% to 1,599
- Pending Sales decreased 8.0% to 1,341
- Inventory decreased 13.6% to 9,791
For the month of April:
- Median Sales Price increased 8.9% to $305,000
- Days on Market decreased 17.5% to 47
- Percent of Original List Price Received increased 0.5% to 99.9%
- Months Supply of Homes For Sale decreased 13.6% to 1.9
All comparisons are to 2019
Click here for the full Weekly Market Activity Report. From MAAR Market Data News.
April Monthly Skinny Video
April’s median sales price was up 8.9% compared to April of last year.
Record high showings the bright spot in April housing numbers
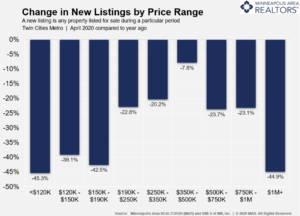
(May 21, 2020) – According to new data from the Minneapolis Area REALTORS® and the Saint Paul Area Association of REALTORS®, both buyer and seller activity was down in April, but the number of residential showings has reached a new high for the year.Both new listings and pending purchase activity was down in April compared to a year ago, but the declines varied dramatically by price range. For homes priced between $350,000 and $500,000, for example, sellers listed just 7.8 percent fewer homes than last April. Homes priced over $1,000,000, however, saw a 44.9 percent decrease in new listings. New listings at the far-affordable end of the market also saw notable declines.

“March started off strong and that strength returned later in April and into May; however, the latter half of March and the start of April saw set-backs due to COVID-19,” said Patrick Ruble, President of the Saint Paul Area Association of REALTORS®. “REALTORS® are busy, and we’ve seen gains for both buyers and sellers in late-April and May.”
The price gains in April may surprise some. In fact, April was the first month on record where the median home price surpassed $300,000. Home prices and closed sales both rose in April, reflecting purchase agreements signed in February and the first half of March. Homes actually sold more quickly this April than last, as health concerns held back some less serious buyers but motivated buyers who remained active and committed.
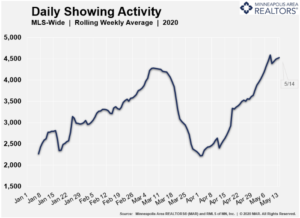
“We expected much of the pull-back resulting from COVID-19 would show up in April, so the shift isn’t that surprising,” said Linda Rogers, President of the Minneapolis Area REALTORS®. “But showings are a leading indicator for purchase activity and they’ve reached new highs for the year. We expect this to translate into stronger sales activity once the health situation stabilizes.”

The recent job losses have impacted some market segments more than others. Buyers in the affordable brackets are more likely to be impacted by job losses in the leisure, hospitality or retail space, while those looking in the luxury brackets may be impacted by volatility in equity markets. The middle-market ranges performed the best, perhaps propped up by salaried professionals who can work from home.
For April, the median Twin Cities home price was up 8.9 percent to $305,000, a new high for the metro area. Mortgage rates on a 30-year fixed loan are around 3.4 percent—just about the lowest they have ever been. While recessions can pause market activity, they typically only have a minor impact on home prices. The undersupplied market—especially at the affordable end—should also prevent any price softening.
April 2020 by the numbers compared to a year ago
- Sellers listed 5,967 properties on the market, a 22.9 percent decrease from last April
- Buyers signed 4,612 purchase agreements, down 20.1 percent (4,609 closed sales, up 3.5 percent)
- Inventory levels declined 13.1 percent to 9,279 units
- Months Supply of Inventory was down 18.2 percent to8 months (5-6 months is balanced)
- The Median Sales Price rose 8.9 percent to $305,000 (over $300,000 for the first time ever)
- Cumulative Days on Market decreased 17.5 percent to 47 days, on average (median of 17)
- Changes in Sales activity varied by market segment
- Single family sales rose 11.1 percent; condo sales were down 33.2 percent; townhome sales declined 5.3 percent
- Traditional sales increased 5.0 percent; foreclosure sales dropped 33.7 percent; short sales fell 43.5 percent
- Previously owned sales were up 4.9 percent; new construction sales climbed 4.7 percent
Weekly Market Report

For Week Ending May 9, 2020
This week ATTOM Data Solutions released their Q1 2020 U.S. Home Equity and Underwater Report, showing that just over one in four homeowners have at least 50% equity in their homes. The Mortgage Bankers Association reported that mortgage applications were up again last week, which is further sign of strengthing buyer interest as much of the country sees a gradual softening of stay-at-home orders due to COVID-19.
In the Twin Cities region, for the week ending May 9:
- New Listings decreased 17.3% to 1,727
- Pending Sales decreased 22.6% to 1,232
- Inventory decreased 13.5% to 9,550
For the month of April:
- Median Sales Price increased 8.9% to $305,000
- Days on Market decreased 17.5% to 47
- Percent of Original List Price Received increased 0.5% to 99.9%
- Months Supply of Homes For Sale decreased 13.6% to 1.9
All comparisons are to 2019
Click here for the full Weekly Market Activity Report. From MAAR Market Data News.
Weekly Market Report

For Week Ending May 2, 2020
The Mortgage Bankers Association reported a 12% increase in mortgage applications last week, reversing a trend of falling activity due to the COVID-19 pandemic. While a positive sign of buyer interest and future home buying activity, application volume was still 20% lower than a year ago. Initial unemployment claims came in at a little more than 3.8 million for the week ending April 25th, which continues the decline seen in recent weeks but still significantly higher than pre-pandemic levels.
In the Twin Cities region, for the week ending May 2:
- New Listings decreased 28.6% to 1,476
- Pending Sales decreased 17.8% to 1,149
- Inventory decreased 12.2% to 9,413
For the month of March:
- Median Sales Price increased 8.0% to $297,000
- Days on Market decreased 7.6% to 61
- Percent of Original List Price Received increased 0.6% to 99.2%
- Months Supply of Homes For Sale decreased 10.0% to 1.8
All comparisons are to 2019
Click here for the full Weekly Market Activity Report. From MAAR Market Data News.
- « Previous Page
- 1
- …
- 77
- 78
- 79
- 80
- 81
- …
- 85
- Next Page »


