Existing Home Sales

 For Week Ending October 11, 2025
Rising housing costs have led many young adults to delay moving out of their parents’ homes. According to the 2023 American Community Survey (ACS), 19.2% of adults aged 25 to 34 lived with a parent or parent-in-law in 2023—approximately 8.5 million people. Although down from a peak of 22% in 2017-2018, the share of young adults living with parents remains elevated compared to 2000, when fewer than 12% did so.
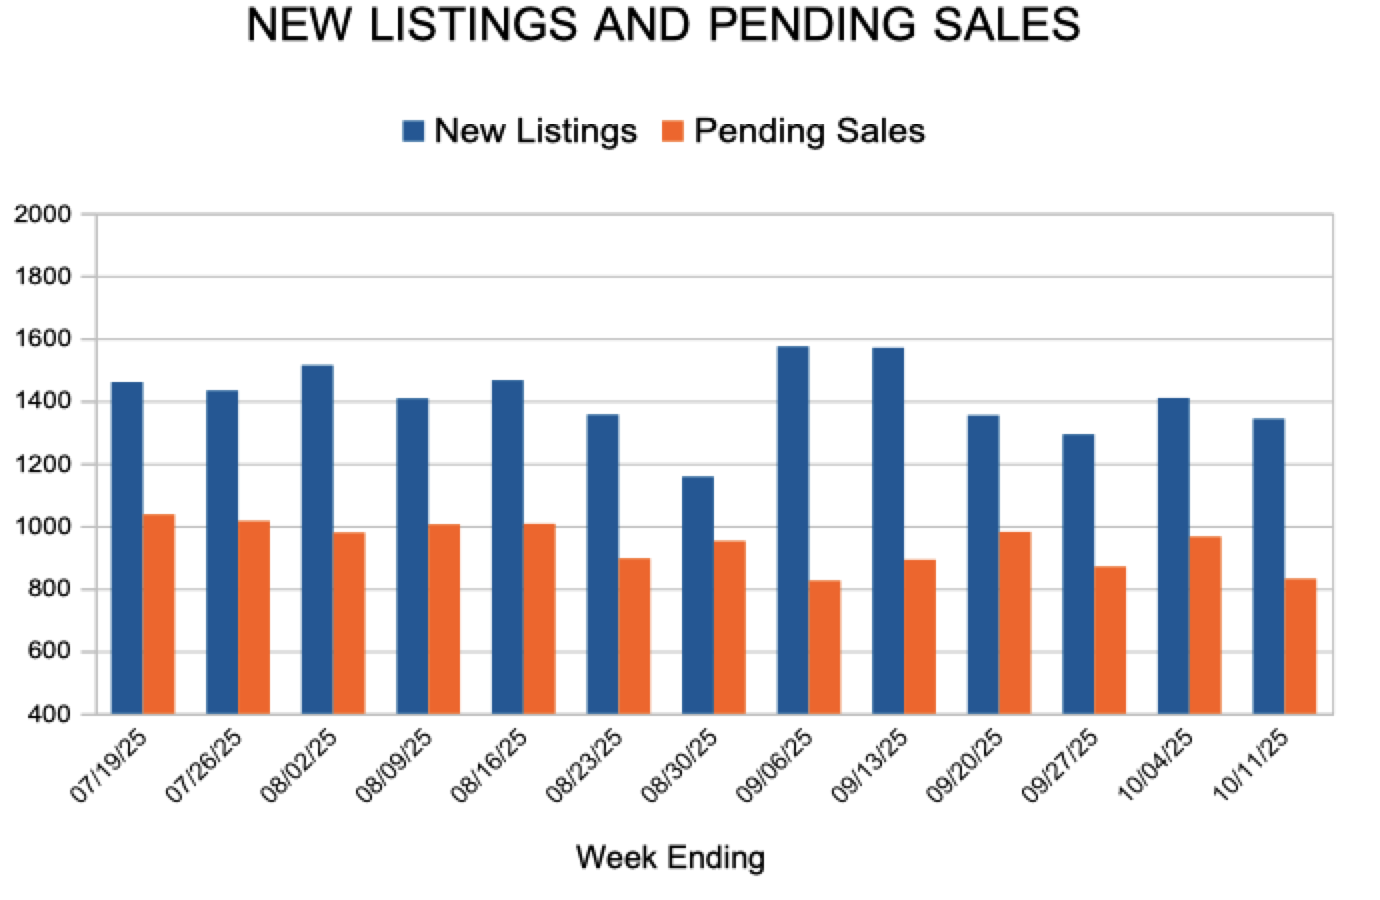
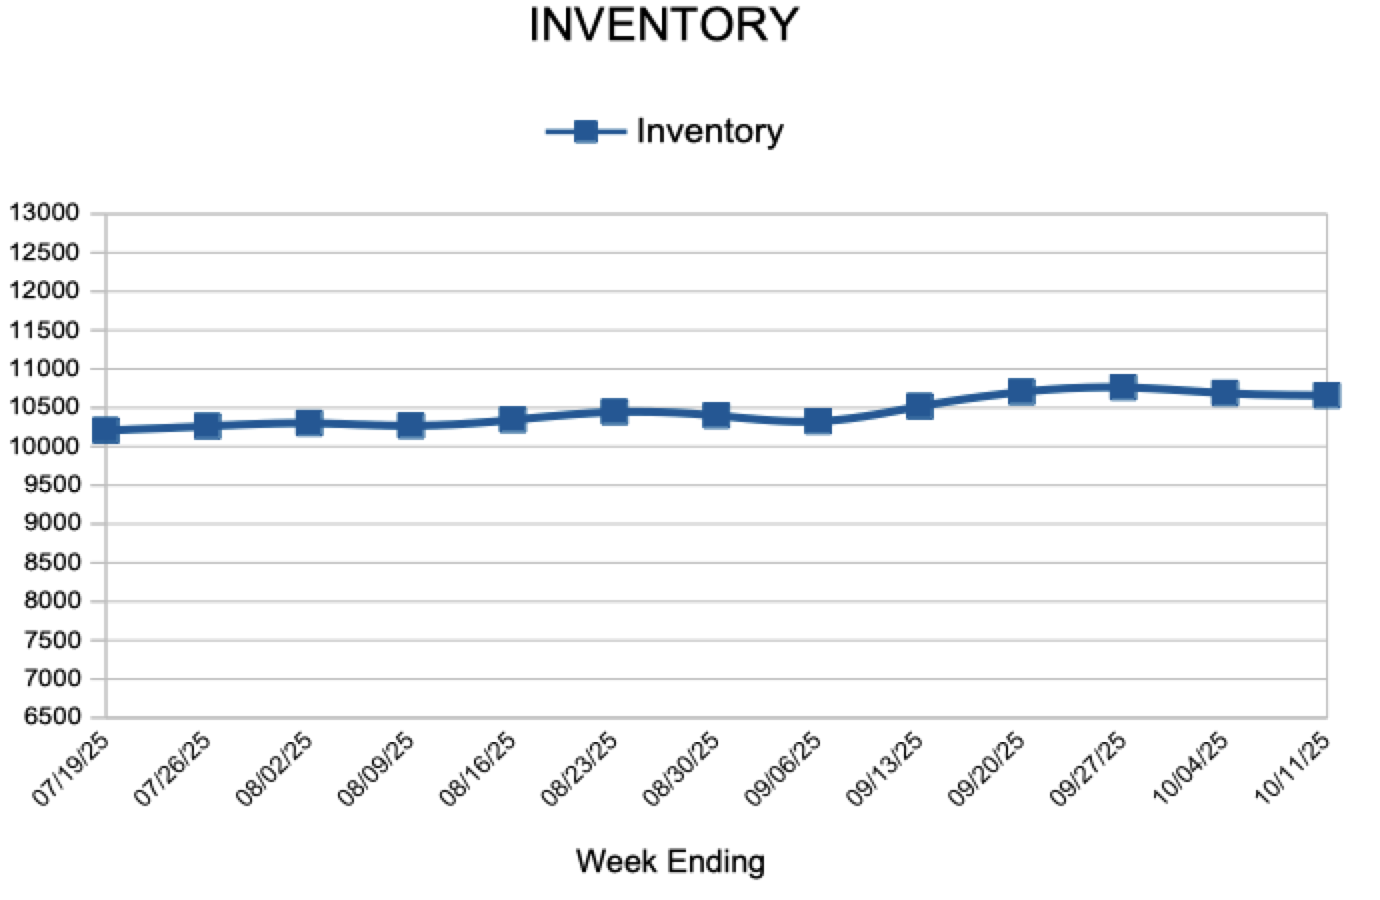
IN THE TWIN CITIES REGION, FOR THE WEEK ENDING OCTOBER 11:
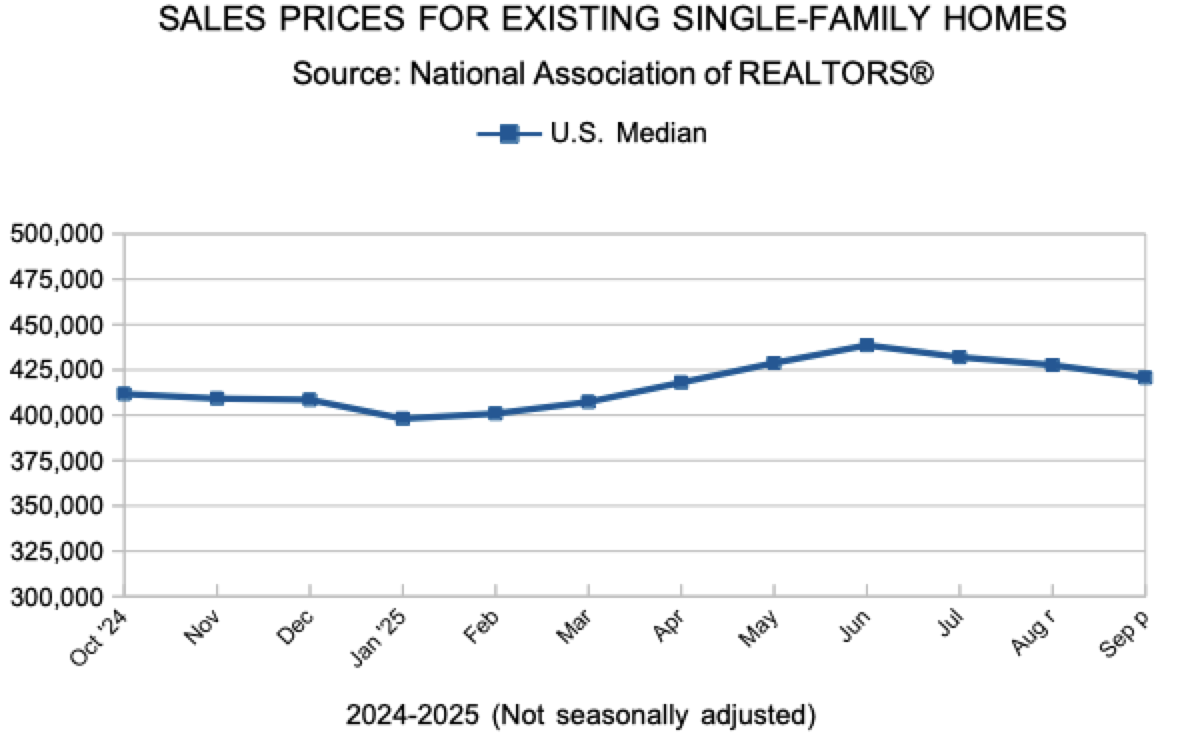
FOR THE MONTH OF SEPTEMBER:
All comparisons are to 2024
Click here for the full Weekly Market Activity Report. From MAAR Market Data News.
October 16, 2025
Mortgage rates inched down this week and have held relatively steady over the past several weeks. Importantly, homeowners have noticed these consistently lower rates, driving an uptick in refinance activity. Combined with increased housing inventory and slower house price growth, these rates also are creating a more favorable environment for those looking to buy a home.
Information provided by Freddie Mac.
 For Week Ending October 4, 2025
Nationally, the best time to buy a home is the week of October 12–18, according to a recent report from Realtor®.com. Historically, this week offers the most favorable conditions for buyers, with higher inventory levels, lower home prices, reduced competition, and a slower market pace. However, the optimal buying window varies across local markets. Some areas have already experienced peak buyer conditions, while others may not reach their ideal period until November or December.
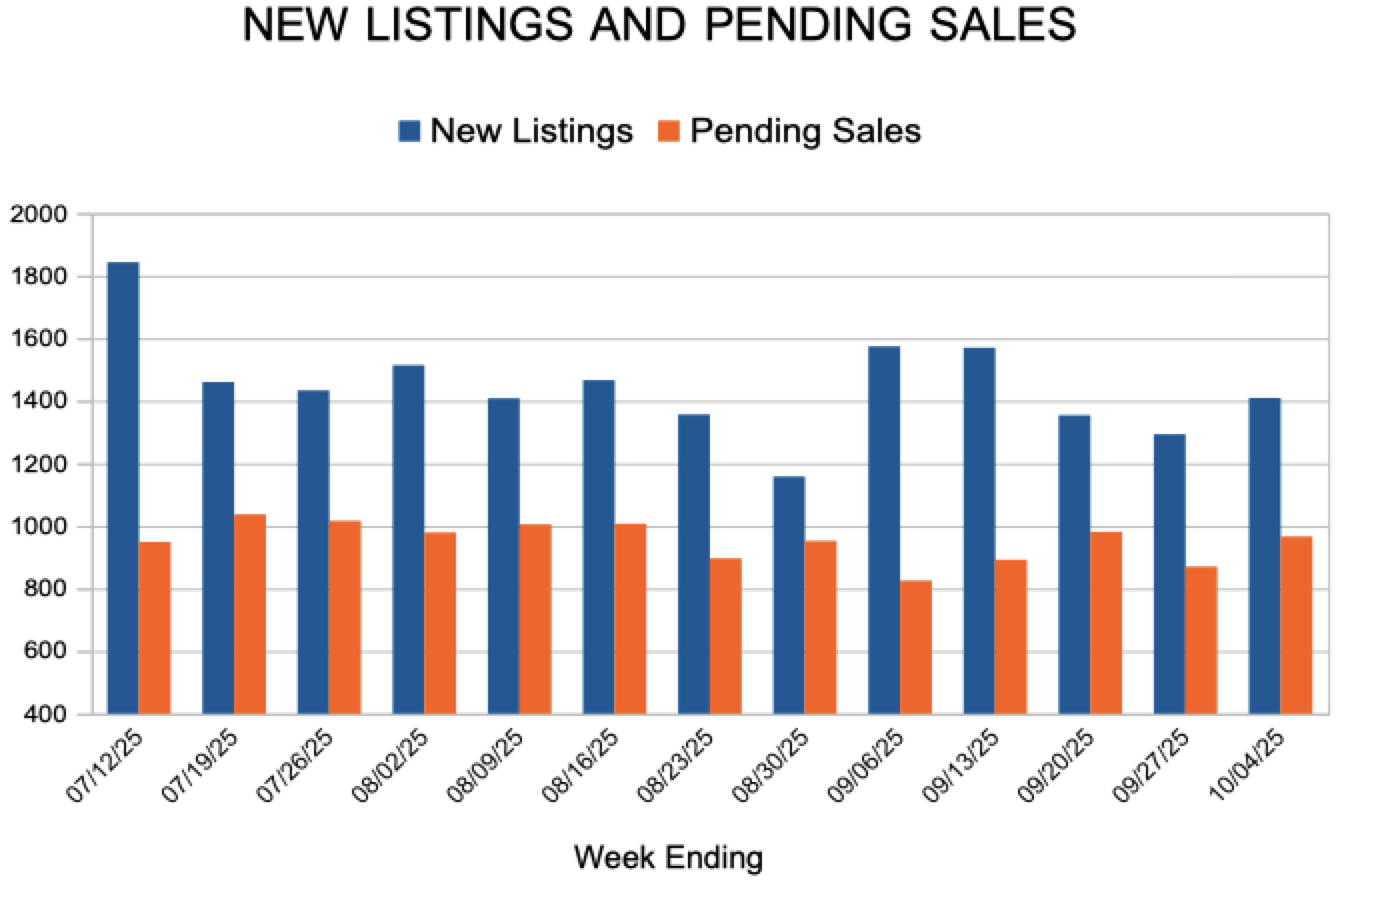
IN THE TWIN CITIES REGION, FOR THE WEEK ENDING OCTOBER 4:
FOR THE MONTH OF AUGUST:
All comparisons are to 2024
Click here for the full Weekly Market Activity Report. From MAAR Market Data News.
October 9, 2025
Mortgage rates decreased this week. Over the last few weeks, mortgage rates have settled in at their lowest level in about a year. There is growing evidence that homebuyers are digesting these lower rates and gradually are willing to move forward with buying a home, which is boosting purchase activity.
Information provided by Freddie Mac.
