 For Week Ending August 30, 2025
Investors purchased 265,000 homes—nearly 27% of all homes sold—in the first quarter of 2025, according to a recent report from BatchData. That’s a 1.2% increase from the same period last year and represents the highest share in at least five years. Between 2020 and 2023, investors purchased an average of 18.5% of homes sold. Investor-owned properties now account for approximately 20% of the country’s 86 million single-family homes.
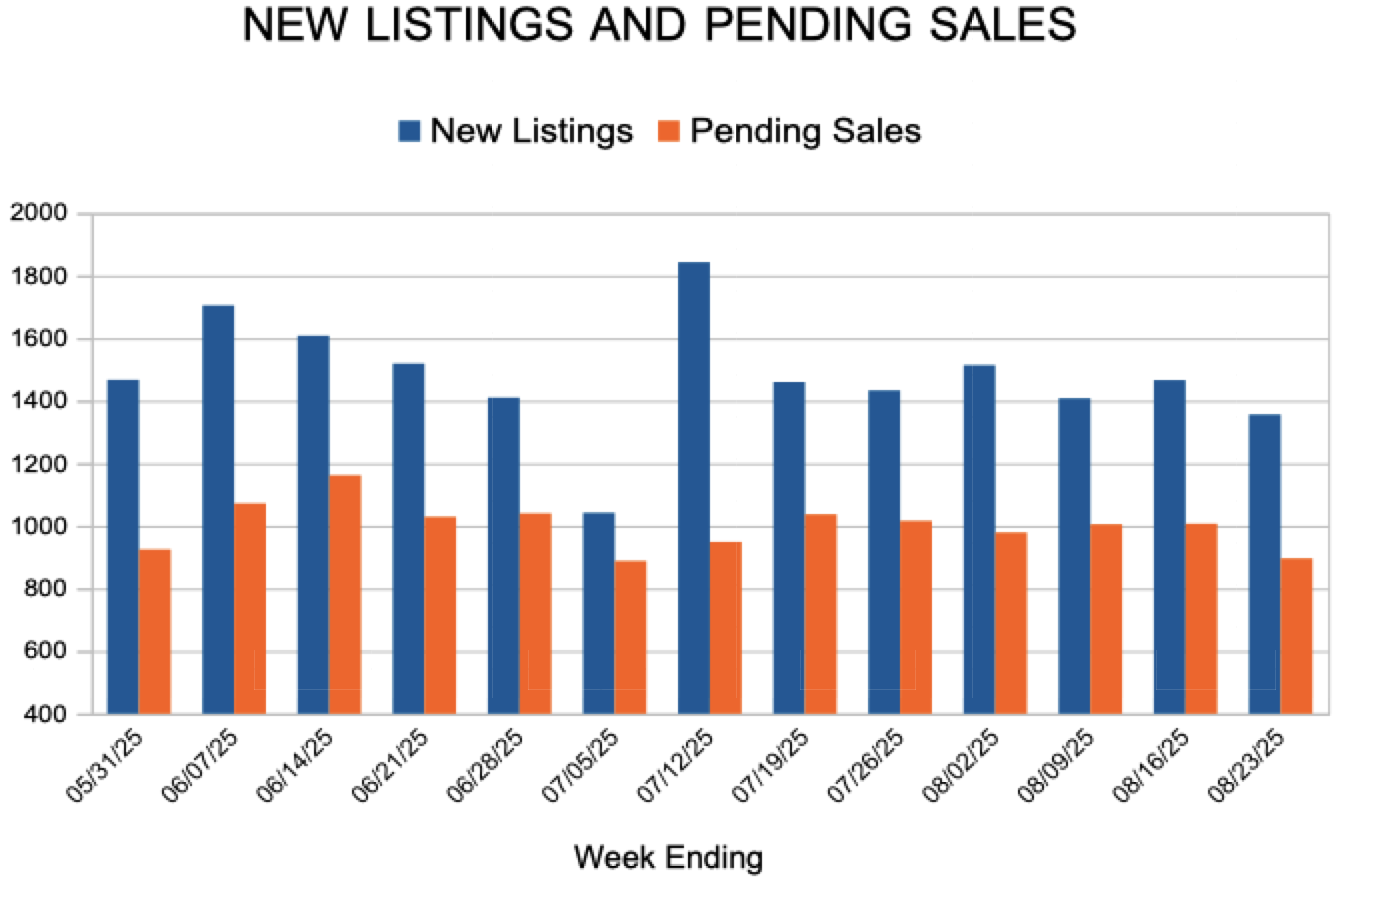
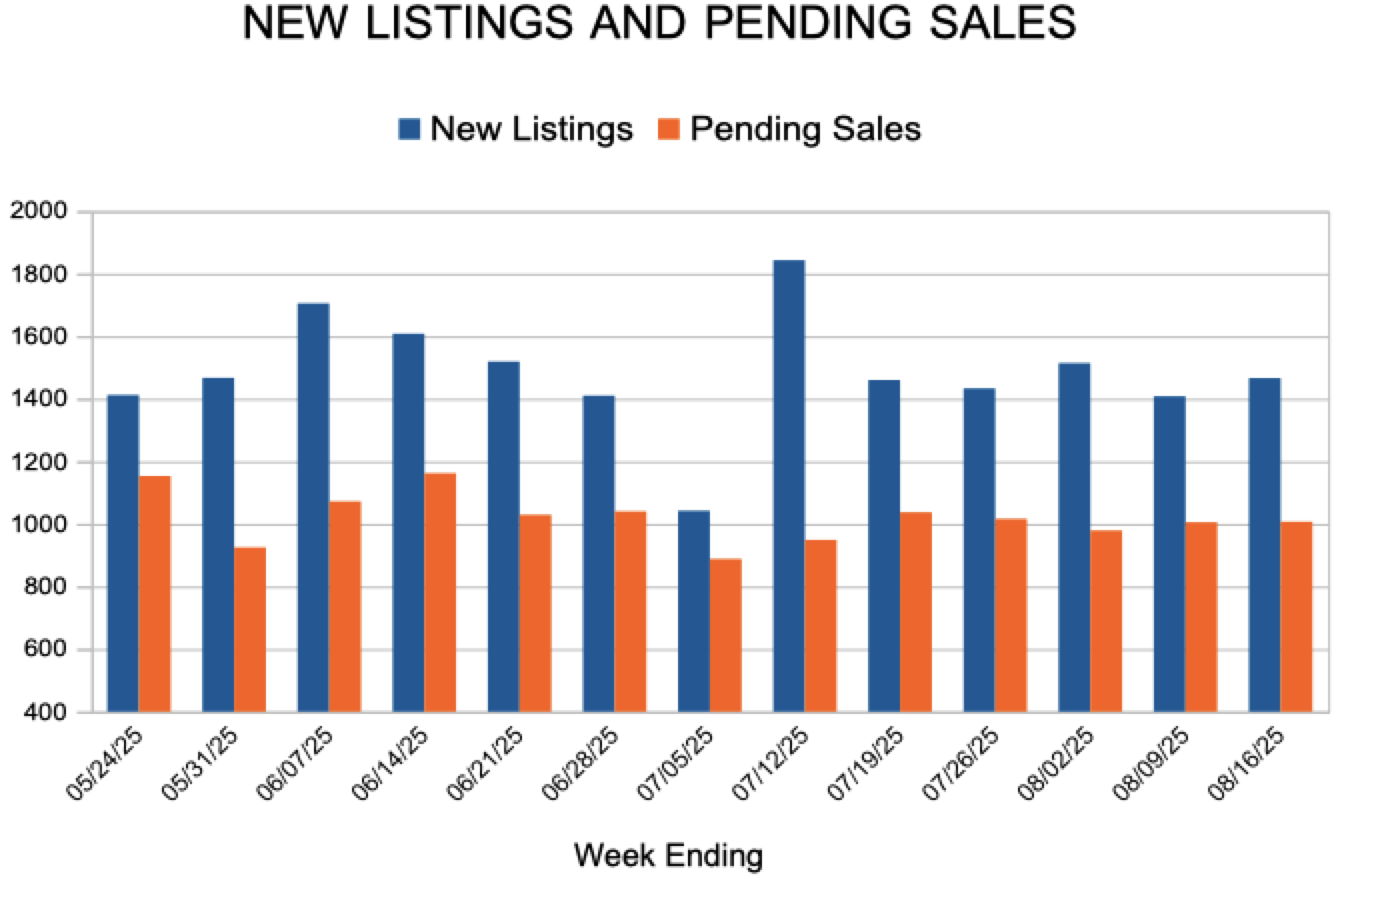
IN THE TWIN CITIES REGION, FOR THE WEEK ENDING AUGUST 30:
- New Listings increased 2.9% to 1,158
- Pending Sales increased 7.9% to 952
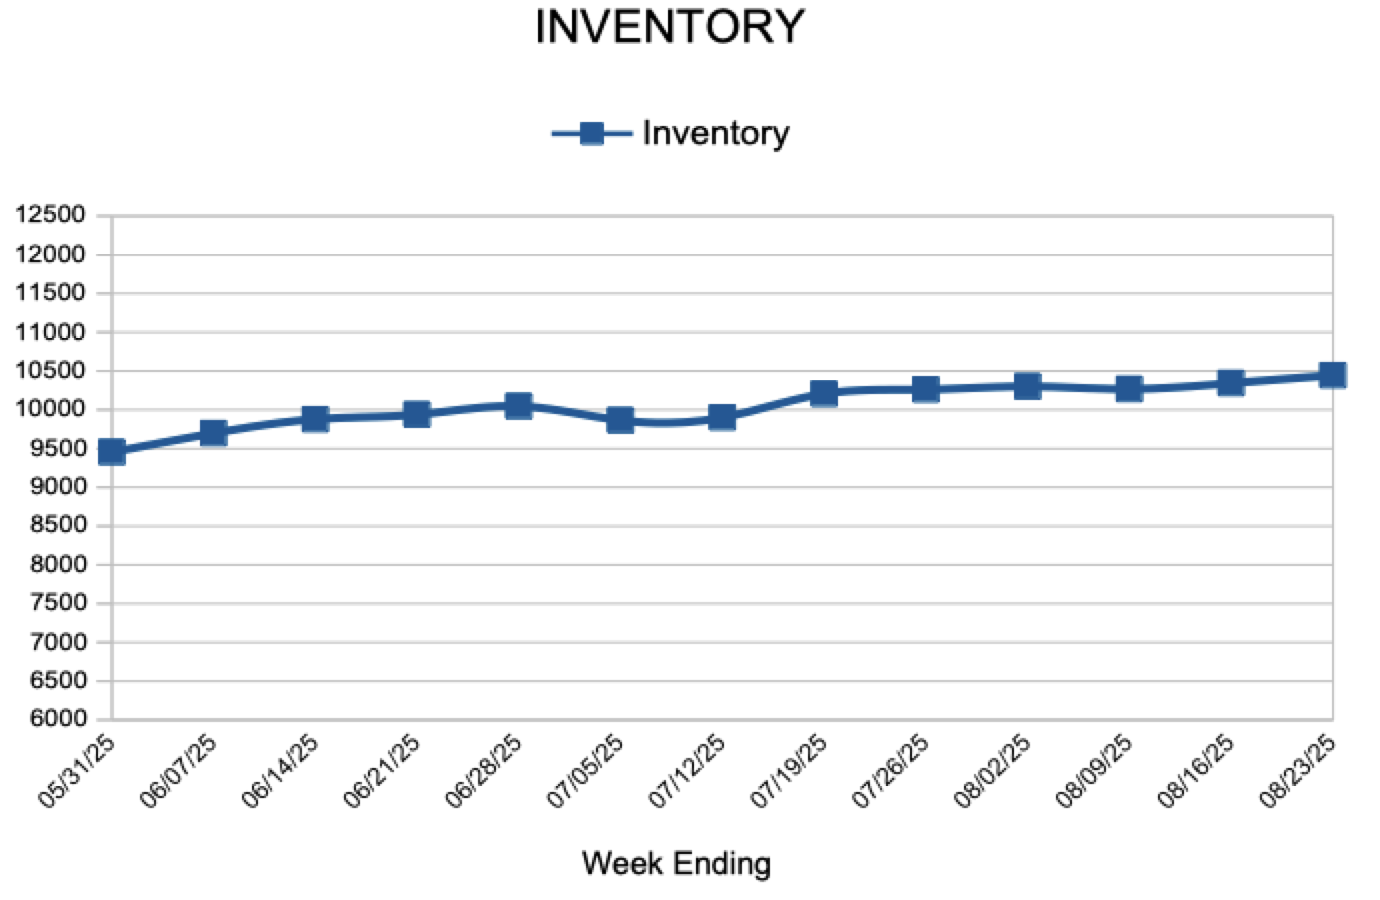
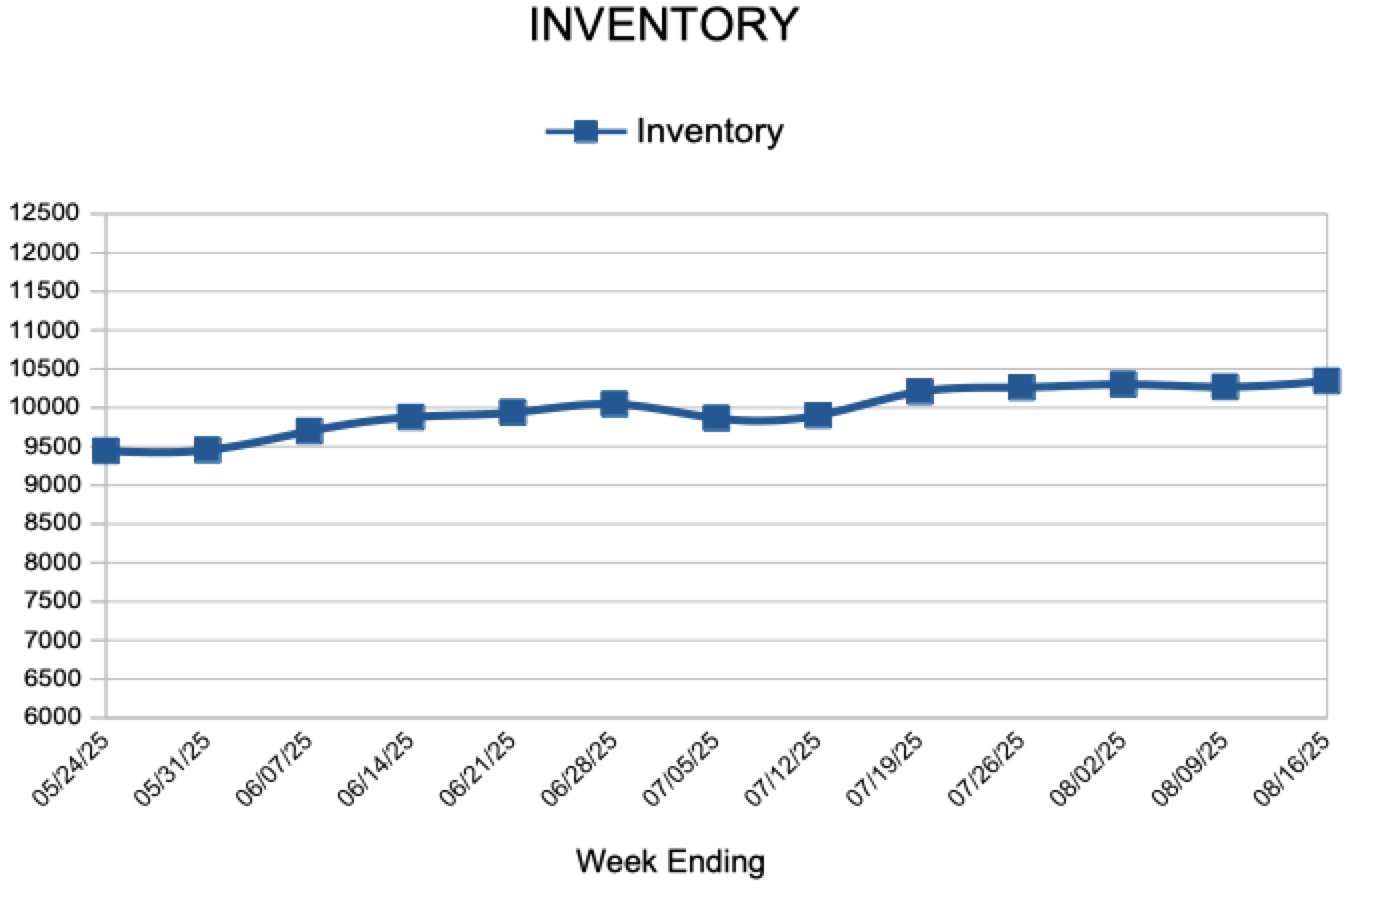
- Inventory increased 1.1% to 10,399
FOR THE MONTH OF JULY:
- Median Sales Price increased 2.6% to $395,000
- Days on Market increased 11.1% to 40
- Percent of Original List Price Received decreased 0.2% to 99.3%
- Months Supply of Homes For Sale remained flat at 2.7
All comparisons are to 2024
Click here for the full Weekly Market Activity Report. From MAAR Market Data News.