Existing Home Sales

August 21, 2025
The 30-year fixed-rate mortgage remained flat this week. Over the summer, rates have come down and purchase applications are outpacing 2024, though a number of homebuyers continue waiting on the sideline for rates to further decrease.
Information provided by Freddie Mac.
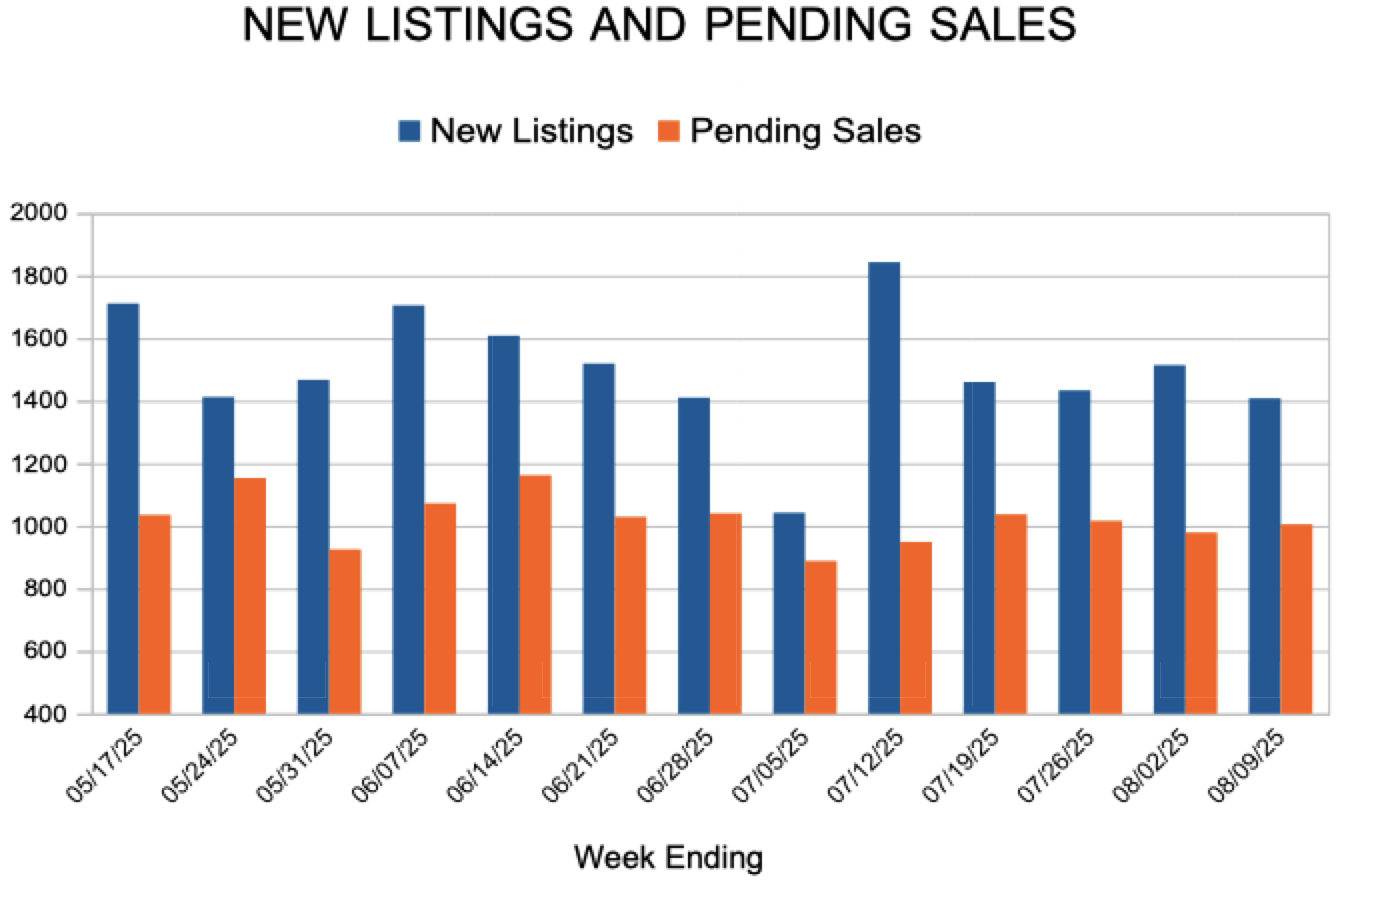
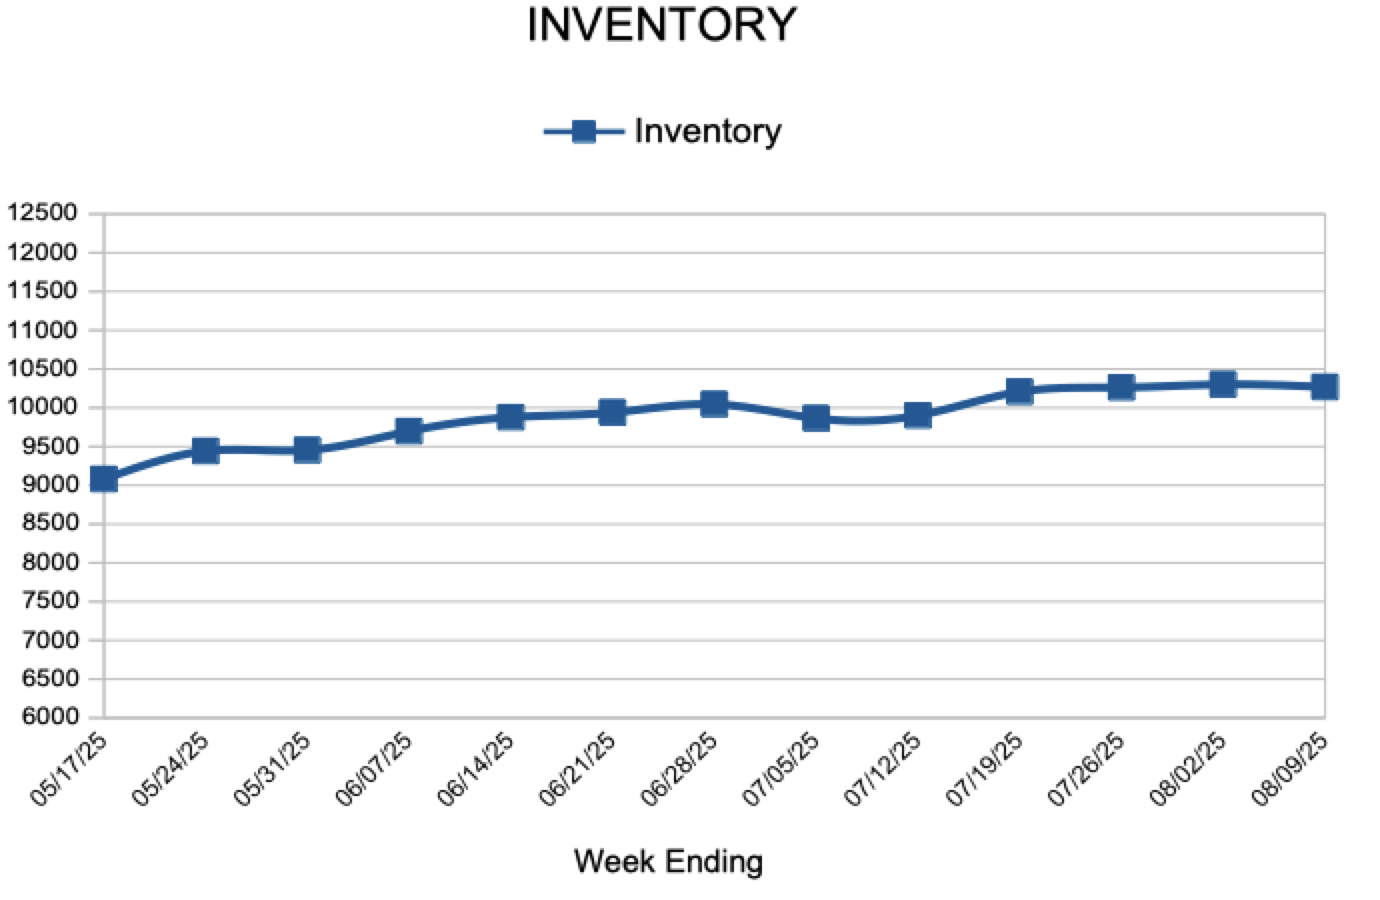
 For Week Ending August 9, 2025
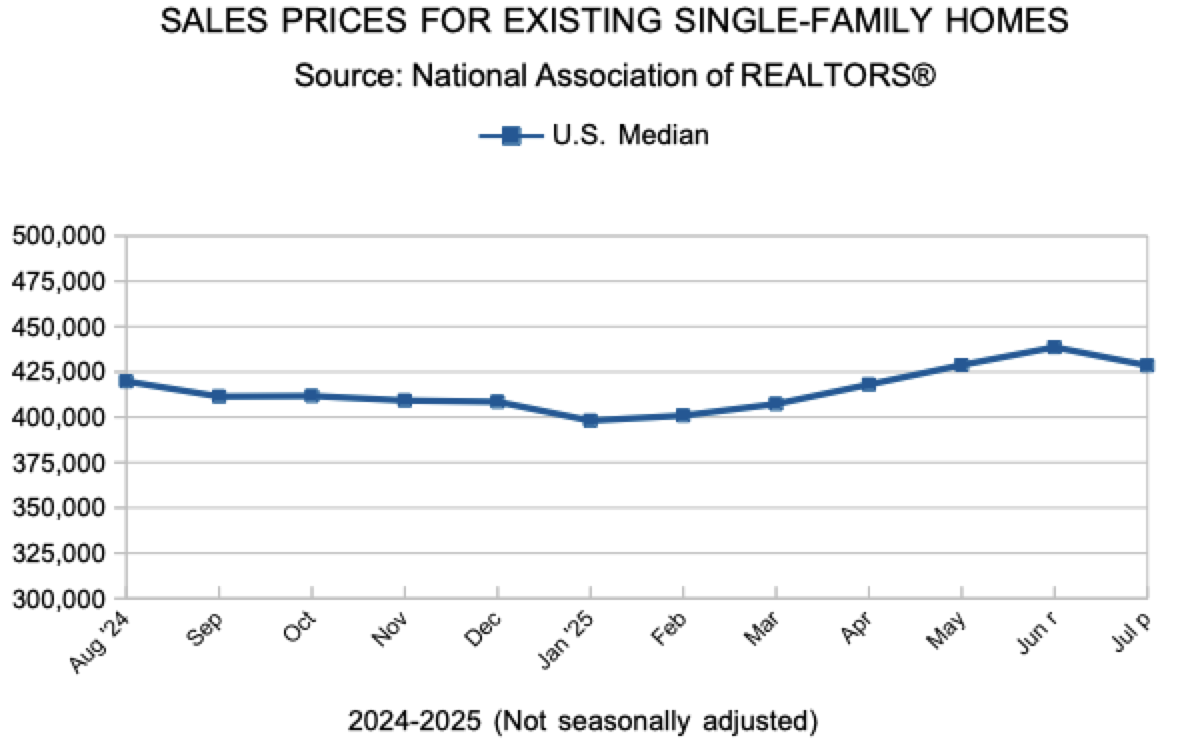
The average monthly mortgage payment on a median-priced home reached a record high of $2,570 in 2024, based on a 30-year fixed-rate loan and a 3.5% down payment, according to the State of the Nation’s Housing 2025 report from Harvard University’s Joint Center for Housing Studies. Using a 31% debt-to-income ratio, a homebuyer would need to earn at least $126,700 per year to afford that monthly payment.
IN THE TWIN CITIES REGION, FOR THE WEEK ENDING AUGUST 9:
FOR THE MONTH OF JULY:
All comparisons are to 2024
Click here for the full Weekly Market Activity Report. From MAAR Market Data News.
August 14, 2025
Mortgage rates fell to their lowest level since October. Purchase application activity is improving as borrowers take advantage of the decline in mortgage rates.
Information provided by Freddie Mac.
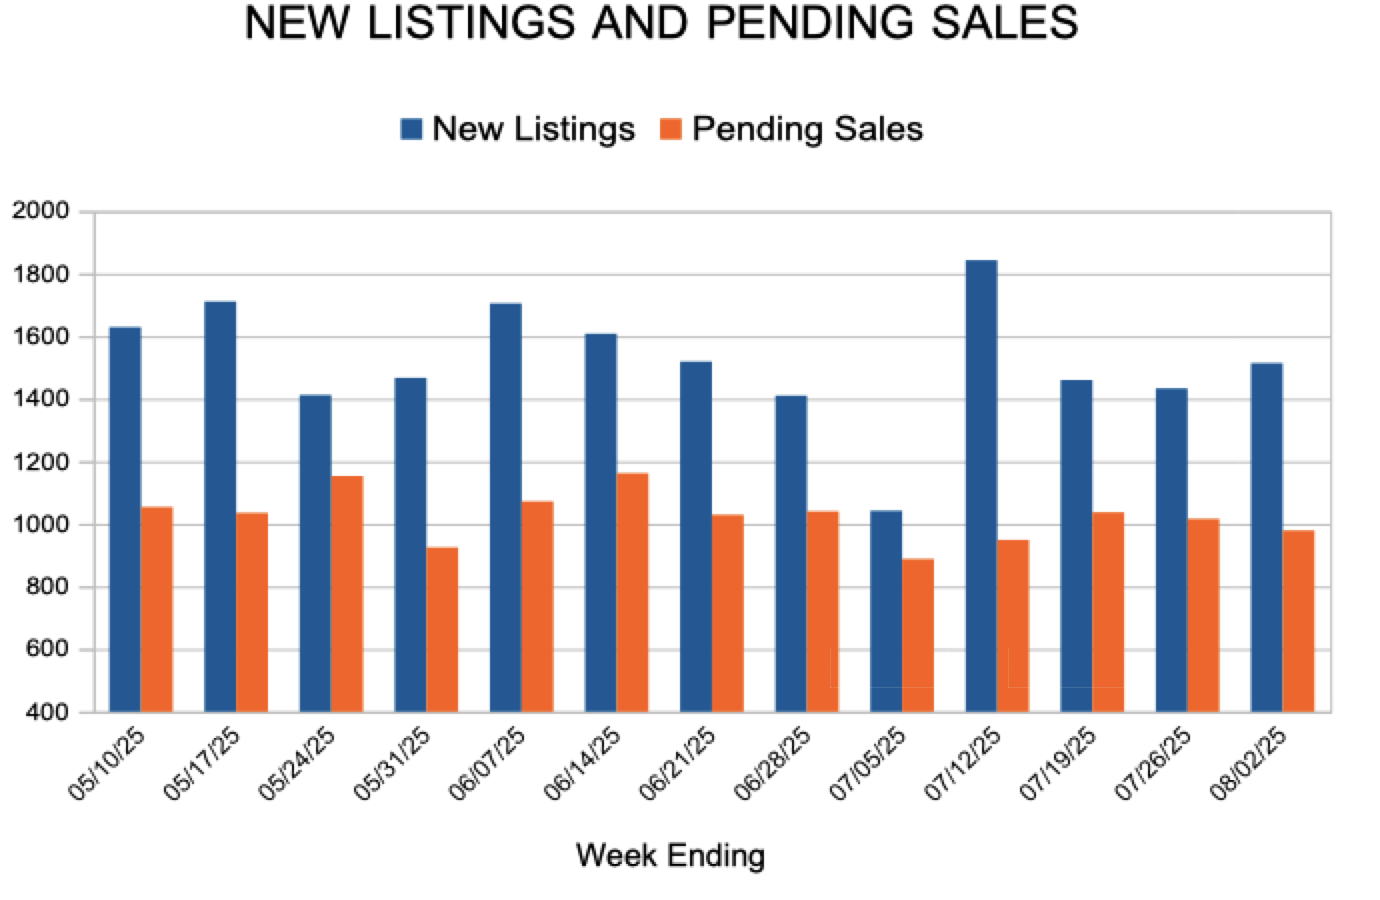
 For Week Ending August 2, 2025
U.S. housing starts rose 4.6% month-over-month to a seasonally adjusted annual rate of 1,321,000 units, according to the U.S. Census Bureau. Single-family housing starts decreased 4.6% from the previous month to a seasonally adjusted annual rate of 883,000 units, while multi-family starts jumped 30.6% to 414,000 units.
IN THE TWIN CITIES REGION, FOR THE WEEK ENDING AUGUST 2:
FOR THE MONTH OF JUNE:
All comparisons are to 2024
Click here for the full Weekly Market Activity Report. From MAAR Market Data News.
August 7, 2025
The 30-year fixed-rate mortgage dropped to its lowest level since April. The decline in rates increases prospective homebuyers’ purchasing power and Freddie Mac research shows that buyers can save thousands by getting quotes from a few different lenders.
Information provided by Freddie Mac.
