For Week Ending May 23, 2026
U.S. sales of new residential homes rose 7.4% month-over-month and 3.3% year-over-year to a seasonally adjusted annual rate of 682,000 in March, according to the U.S. Census Bureau. There were approximately 481,000 new homes for sale at the end of March, representing an 8.5-month supply at the current sales pace. The median new-home sales price was $387,400, down 6.2% from a year earlier.
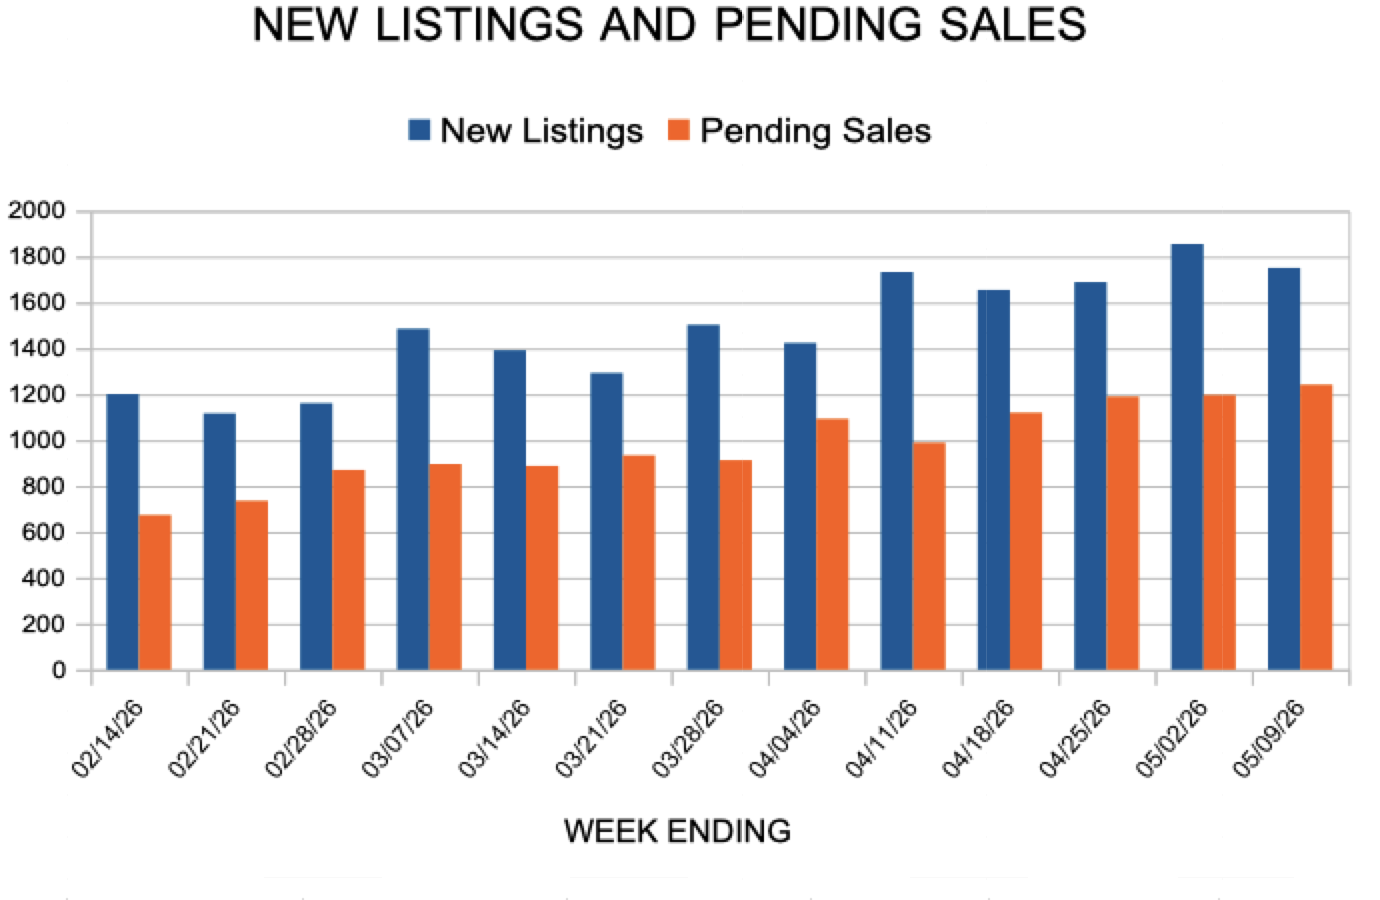
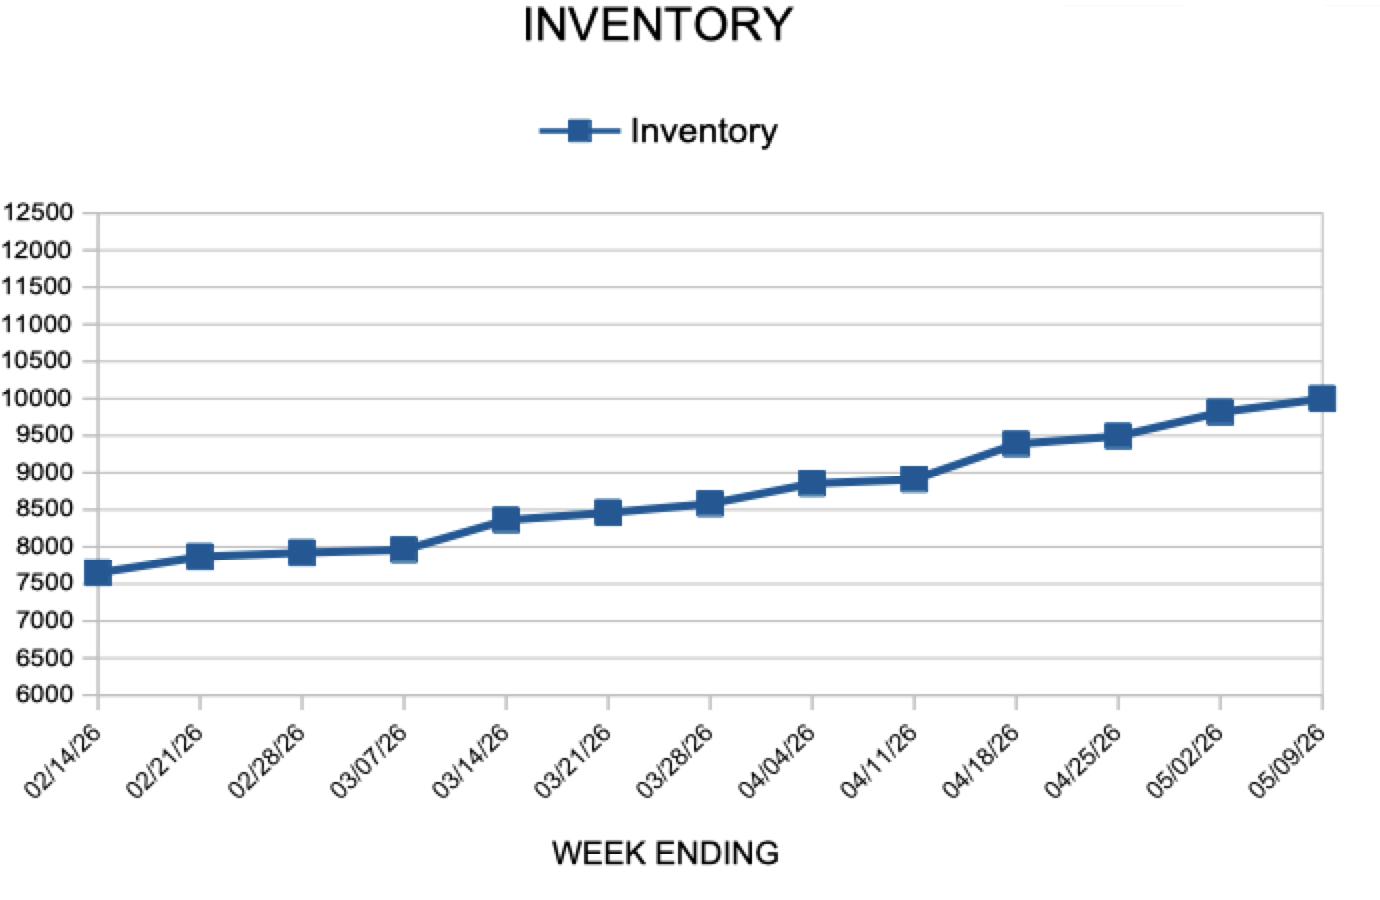
In the Twin Cities region, for the week ending May 23:
- New Listings increased 9.1% to 1,586
- Pending Sales increased 7.2% to 1,257
- Inventory increased 5.9% to 10,480
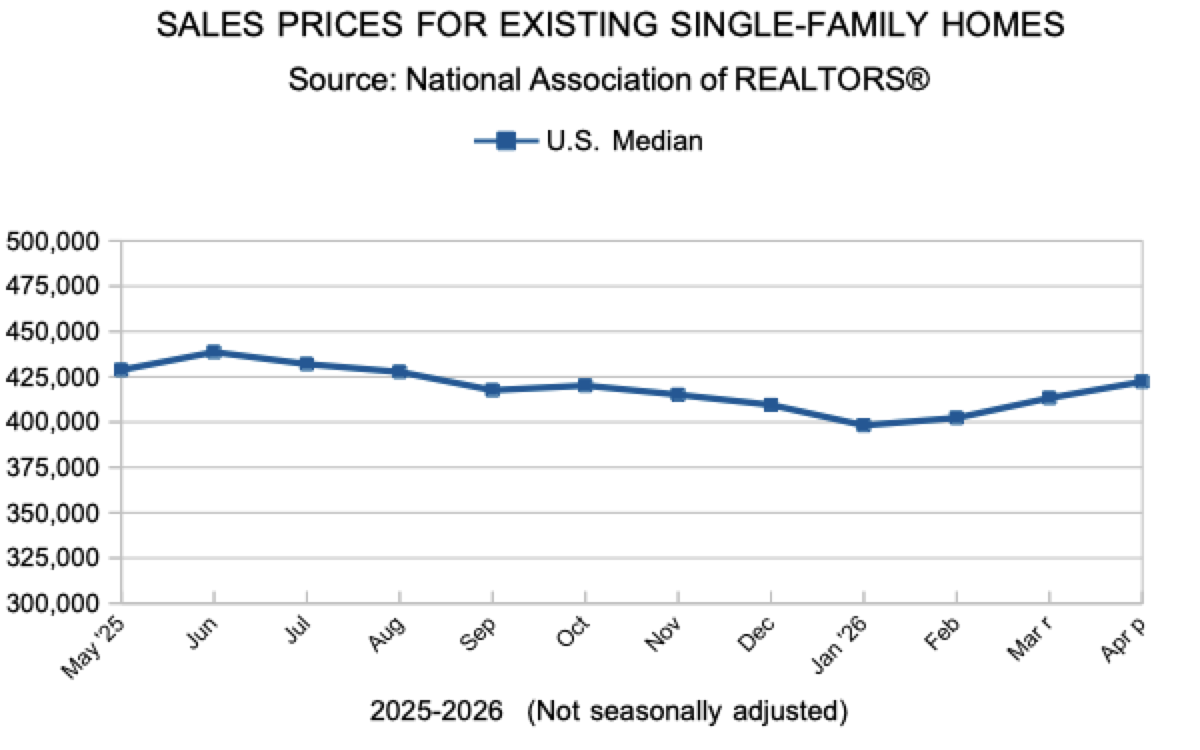
For the month of April:
- Median Sales Price decreased 2.0% to $392,000
- Days on Market increased 14.0% to 57
- Percent of Original List Price Received decreased 0.4% to 99.3%
- Months Supply of Homes For Sale increased 8.3% to 2.7
All comparisons are to 2025
Click here for the full Weekly Market Activity Report. From MAAR Market Data News.