
With the inventory of homes for sale still constrained, a competitive market for buyers shows little sign of waning.
Weekly Market Report

For Week Ending August 15, 2020
Weekly new unemployment insurance claims dropped below one million for the first time since March last week. More than 28 million people are receiving some form of unemployment benefits as of July 25th, which was down more than 3 million from the previous week. Economists are concerned that many of those laid off since the start of COVID-19 may lose their jobs permanently, as some businesses, both large and small, have downsized or closed in recent months. Replacing those lost jobs is likely to be a lengthy process.
In the Twin Cities region, for the week ending August 15:
- New Listings increased 6.4% to 1,842
- Pending Sales increased 12.3% to 1,563
- Inventory decreased 30.0% to 9,252
For the month of July:
- Median Sales Price increased 10.6% to $313,000
- Days on Market increased 7.9% to 41
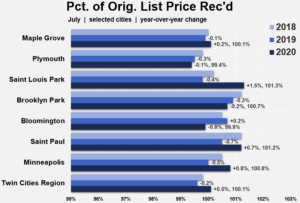
- Percent of Original List Price Received increased 0.5% to 100.1%
- Months Supply of Homes For Sale decreased 29.6% to 1.9
All comparisons are to 2019
Click here for the full Weekly Market Activity Report. From MAAR Market Data News.
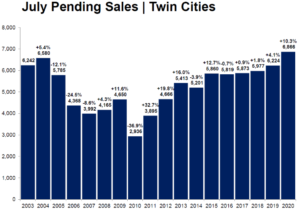
July signed purchase agreements highest since at least 2003
New listings up, price growth accelerates, but some activity from Q2 was postponed into July
(August 20, 2020) – According to new data from the Minneapolis Area REALTORS® and the Saint Paul Area Association of REALTORS®, buyer and seller activity in the 16-county Twin Cities metro both increased from 2019.
After double-digit declines in April and May, the number of signed purchase agreements rose 7.5 percent in June and another 10.3 percent in July, both compared to last July. At 6,866, July 2020 saw the highest pending sales figure since at least 2003, and likely longer. However, some of the pent-up demand from April and May was shifted into June and July, meaning sellers accepted about as many offers this July as they typically have in May of each of the prior four years. Nevertheless, the gain has turned even year-to-date pending sales positive—now up 1.3 percent compared to 2019.
“With interest rates at record lows, in some cases below 3.0 percent, we are experiencing strong demand from buyers to lock in their purchases,” said Patrick Ruble, president of the Saint Paul Area Association of REALTORS®. “If not for the pandemic, some of these accepted offers in July that set new records might have taken place in May or June.”
Although new listings increased 0.8 percent from last July, sellers struggled to keep up with all the demand. Those that did sell received, on average, 100.1 percent of their original asking price—the 2nd highest figure on record since 2003 after June 2018. Price growth also accelerated; the median price jumped 10.4 percent to $312,500. Record-low interest rates can partly offset declines in affordability spurred by rising prices.
“July was an undeniably strong month, particularly in light of some of the headwinds,” according to Linda Rogers, President of Minneapolis Area REALTORS®. “Most areas saw sales growth and other improvements, including both large core cities, where buyers continued to outbid each other.”
Minneapolis sellers received offers that were on average 100.8 percent of their list price. In other words, sellers got more than their list price. In St. Louis Park, St. Paul and Brooklyn Park the figures were 101.3, 101.2 and 100.7 percent respectively. Both buyer and seller activity were up double-digits in both Minneapolis and St. Paul.
Some buyers are opting for newer, farther-out suburban subdivisions that are car-dependent and still growing but come with the latest technology and more space for tele-commuting. An uptick in condo listings can anecdotally be attributed more to health concerns and a temporary closure of businesses and limited activities than any recent unrest. More time is needed to evaluate this.
July 2020 by the numbers compared to a year ago
- Sellers listed 7,961 properties on the market, a 0.8 percent increase from last July
- Buyers signed 6,866 purchase agreements, up 10.3 percent (6,940 closed sales, up 3.4 percent)
- Inventory levels fell 28.0 percent to 9,348 units
- Months Supply of Inventory was down 29.6 percent to 1.9 months (5-6 months is balanced)
- The Median Sales Price rose 10.4 percent to $312,500
- Cumulative Days on Market increased 7.9 percent to 41 days, on average (median of 17, down 5.6 percent)
- Changes in Sales activity varied by market segment
- Single family sales were up 7.3 percent; condo sales fell 10.8 percent; townhome sales decreased 2.6 percent
- Traditional sales rose 4.6 percent; foreclosure sales dropped 42.1 percent; short sales fell 6.7 percent
- Previously owned sales were up 2.5 percent; new construction sales climbed 27.7 percent
Weekly Market Report
For Week Ending August 8, 2020
As the major stock market indexes continue to be at or near record highs, we find the housing market in high demand as well. Mortgage rates are still at or near record lows and home buyer activity remains strong. While uncertainty remains on what effects the upcoming elections and any seasonal resurgence of COVID-19 may have on the financial and housing market, healthy housing demand fundamentals today will create significant tailwinds in the near term.
In the Twin Cities region, for the week ending August 8:
- New Listings increased 0.5% to 1,839
- Pending Sales increased 19.1% to 1,663
- Inventory decreased 29.4% to 9,291
For the month of July:
- Median Sales Price increased 10.6% to $313,000
- Days on Market increased 7.9% to 41
- Percent of Original List Price Received increased 0.5% to 100.1%
- Months Supply of Homes For Sale decreased 29.6% to 1.9
All comparisons are to 2019
Click here for the full Weekly Market Activity Report. From MAAR Market Data News.
Weekly Market Report
For Week Ending August 1, 2020
While the Bureau of Economic Analysis reported this week that the US economy contracted at a 32.9% annual rate in Q2 2020, the housing market continues to show strength. Freddie Mac reported 30-year fixed-rate mortgages are hovering around 3% with .8 points, which is three-quarters of a percent lower than this time last year. With showing activity and pending sales still posting strong numbers, the housing market looks to continue to be a bright spot in economic activity.
In the Twin Cities region, for the week ending August 1:
- New Listings decreased 12.1% to 1,774
- Pending Sales increased 9.0% to 1,563
- Inventory decreased 28.2% to 9,332
For the month of June:
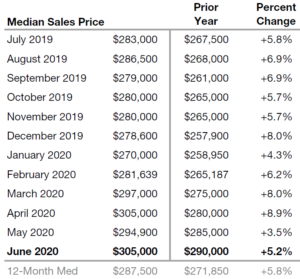
- Median Sales Price increased 5.2% to $305,000
- Days on Market increased 2.4% to 42
- Percent of Original List Price Received decreased 0.4% to 99.6%
- Months Supply of Homes For Sale decreased 25.9% to 2.0
All comparisons are to 2019
Click here for the full Weekly Market Activity Report. From MAAR Market Data News.
Weekly Market Report
For Week Ending July 25, 2020
The Mortgage Bankers Association reported that their Purchase Index of mortgage applications was 19 percent higher than the same week one year ago. Continued high levels of home purchase mortgage applications suggests that home buyer interest and activity will remain strong in the coming weeks.
In the Twin Cities region, for the week ending July 25:
- New Listings increased 0.7% to 1,777
- Pending Sales increased 8.8% to 1,499
- Inventory decreased 28.7% to 9,303
For the month of June:
- Median Sales Price increased 5.2% to $305,000
- Days on Market increased 2.4% to 42
- Percent of Original List Price Received decreased 0.4% to 99.6%
- Months Supply of Homes For Sale decreased 25.9% to 2.0
All comparisons are to 2019
Click here for the full Weekly Market Activity Report. From MAAR Market Data News.
Weekly Market Report
For Week Ending July 18, 2020
The latest figures released by the Department of Commerce show total housing starts in June rose 17.3% to a seasonally adjusted annual rate of 1.19 million units, with single-family units leading the way with a 17.2% increase to a seasonally adjusted rate of 831,000 per year. With demand for housing strong across most of the nation, this increase in new construction is welcome, but will do little to significantly impact the lack of housing inventory nationwide.
In the Twin Cities region, for the week ending July 18:
- New Listings decreased 9.1% to 1,753
- Pending Sales increased 10.2% to 1,541
- Inventory decreased 27.2% to 9,339
For the month of June:
- Median Sales Price increased 5.2% to $304,995
- Days on Market increased 2.4% to 42
- Percent of Original List Price Received decreased 0.4% to 99.6%
- Months Supply of Homes For Sale decreased 29.6% to 1.9
All comparisons are to 2019
Click here for the full Weekly Market Activity Report. From MAAR Market Data News.
June Monthly Skinny Video
Even as hopes of a phased June reopening all but faded, real estate activity continued to strengthen.
Weekly Market Report
For Week Ending July 11, 2020
Mortgage rates continue to hit new lows. This week, mortgage giant Freddie Mac reported that rates on a 30-year fixed-rate mortgage fell to a new record low of 3.03% with an average of .8 points. That is down from 3.07% last week and 3.75% from the same week a year ago. Record-low rates are continuing to boost already strong buyer demand throughout most of the country and economists expect rates to continue to remain low in the near future.
In the Twin Cities region, for the week ending July 11:
- New Listings decreased 18.8% to 1,834
- Pending Sales decreased 0.5% to 1,507
- Inventory decreased 25.9% to 9,287
For the month of June:
- Median Sales Price increased 5.2% to $305,000
- Days on Market increased 2.4% to 42
- Percent of Original List Price Received decreased 0.4% to 99.6%
- Months Supply of Homes For Sale decreased 29.6% to 1.9
All comparisons are to 2019
Click here for the full Weekly Market Activity Report. From MAAR Market Data News.
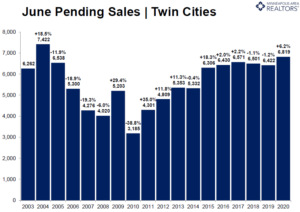
June signed purchase agreements reach highest level since 2004
New Highs For Showings Suggest Further Strengthening, Though Inventory Still A Challenge
(July 16, 2020) – According to new data from the Minneapolis Area REALTORS® and the Saint Paul Area Association of REALTORS®, market activity in the 16-county Twin Cities metro continued to recover from the April and May declines.
After double-digit declines in April and May, the number of purchase contracts signed in June increased 6.2 percent from last year. That brought the number of pending sales to 6,819 for the month, the highest June figure since 2004. Some of the pent-up demand from April and May was shifted into June instead of being cancelled outright.
Most of the increase was in the single-family segment. Newly built homes also saw a large gain as buyers were eyeing more space and perhaps a second home office, but also found existing options limited. Record low mortgage rates were another motivating factor for buyers—particularly first-time buyers.
“It is still very busy, but there is little inventory,” said Patrick Ruble, president of the St. Paul Area Association of REALTORS®. “Buyers enticed by historically low mortgage rates in April or May can still capitalize on those rates now; however, because there is no inventory we really need to see an increase in listings.”
Sellers are struggling to keep up, though that may be changing. After greater than 20.0 percent declines during April and May, new listings shrank 14.6 percent in June. The share of the list price that sellers received was still down slightly from last year, but at 99.6 percent, it remains at a very high level. The region had 1.8 months of supply in June, indicating a strong and undersupplied sellers’ market. A balanced market has around 5 or 6 months of supply. By contrast, the over $1M luxury segment had more than 11.0 months of supply in June.
“An encouraging showings trend alongside strong demand and a limited supply of homes should continue to support prices,” said Linda Rogers, President of Minneapolis Area REALTORS®. “While still positive, the rate of price growth moderated in May. Now June home price growth is roughly on-pace with the last 12 months.”
The Federal Reserve pushed interest rates on a 30-year fixed mortgage to around 3.0 percent—the lowest figure recorded in more than 50 years. Attractive interest rates can partly offset declines in affordability. Despite that being a motivating factor, the limited supply of homes for sale is one of the biggest challenges for buyers. Sellers are slowly gaining more confidence around health concerns, but a resurgence in COVID-19 cases could dampen that. While condo sales were still lagging, the data shows buyer and seller activity in Minneapolis is comparable to surrounding cities and suburbs.
June 2020 By The Numbers Compared To A Year Ago
- Sellers listed 7,306 properties on the market, a 14.6 percent decrease from last June
- Buyers signed 6,819 purchase agreements, up 6.2 percent (6,118 closed sales, down 8.8 percent)
- Inventory levels fell 29.8 percent to 9,154 units
- Months Supply of Inventory was down 33.3 percent to8 months (5-6 months is balanced)
- The Median Sales Price rose 5.2 percent to $305,000
- Cumulative Days on Market increased 2.4 percent to 41 days, on average (median of 18)
- Changes in Sales activity varied by market segment
- Single family sales were up 10.2 percent; condo sales fell 12.6 percent; townhome sales increased 0.4 percent
- Traditional sales rose 7.1 percent; foreclosure sales dropped 23.2 percent; short sales fell 29.4 percent
- Previously owned sales were up 5.1 percent; new construction sales climbed 35.2 percent
- « Previous Page
- 1
- …
- 76
- 77
- 78
- 79
- 80
- …
- 86
- Next Page »
