 For Week Ending November 1, 2025
U.S. homebuilder confidence rose five points to 37 in October, marking the highest
reading since April, according to the NAHB/Wells Fargo Housing Market Index
(HMI). Future sales expectations increased nine points to 54, surpassing the 50-
point mark for the first time since January. 38% of builders reported cutting prices
in October, with an average price reduction of 6%.
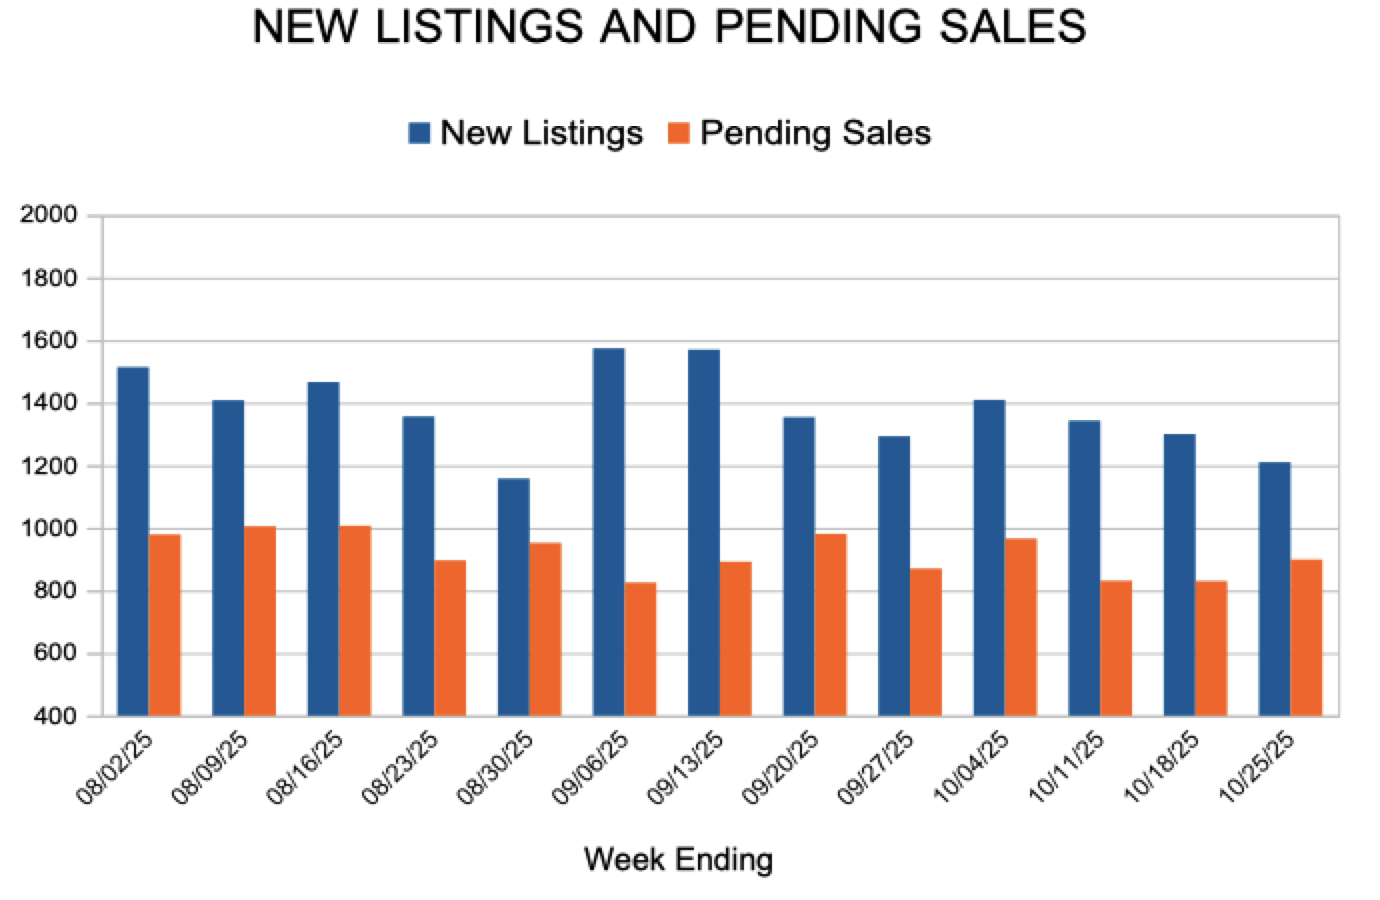
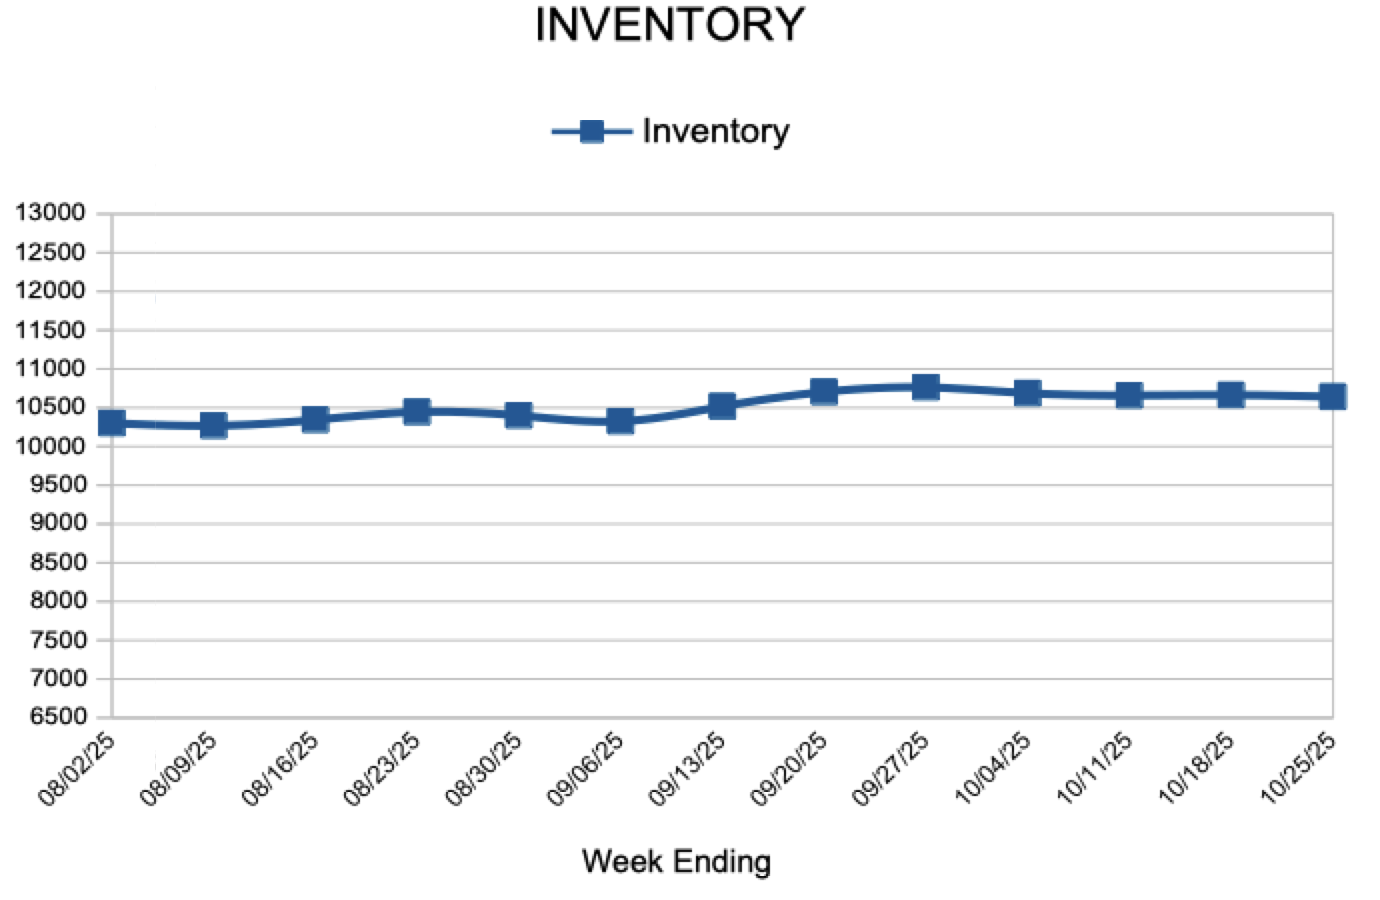
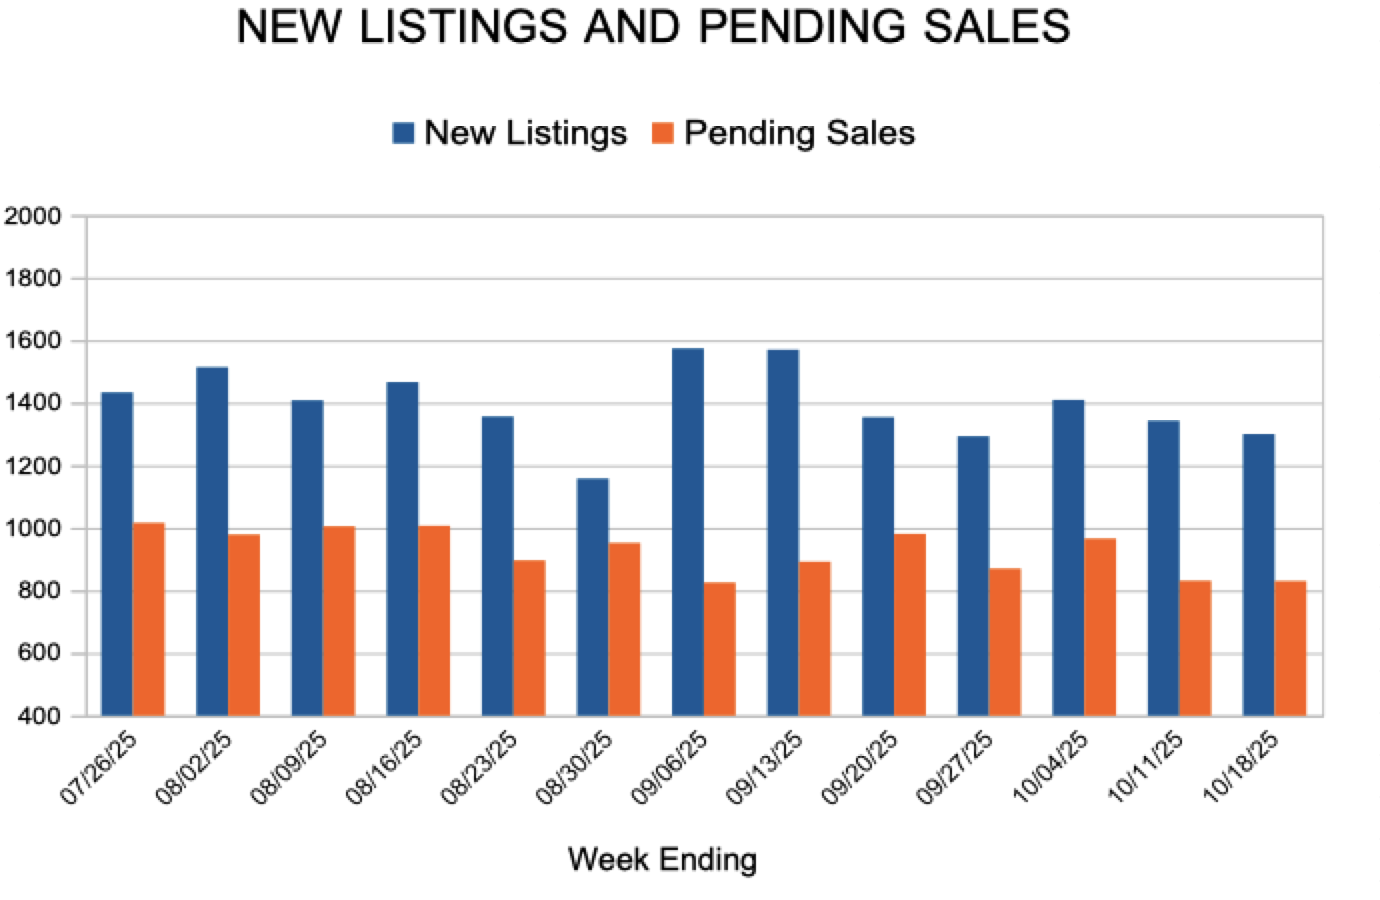
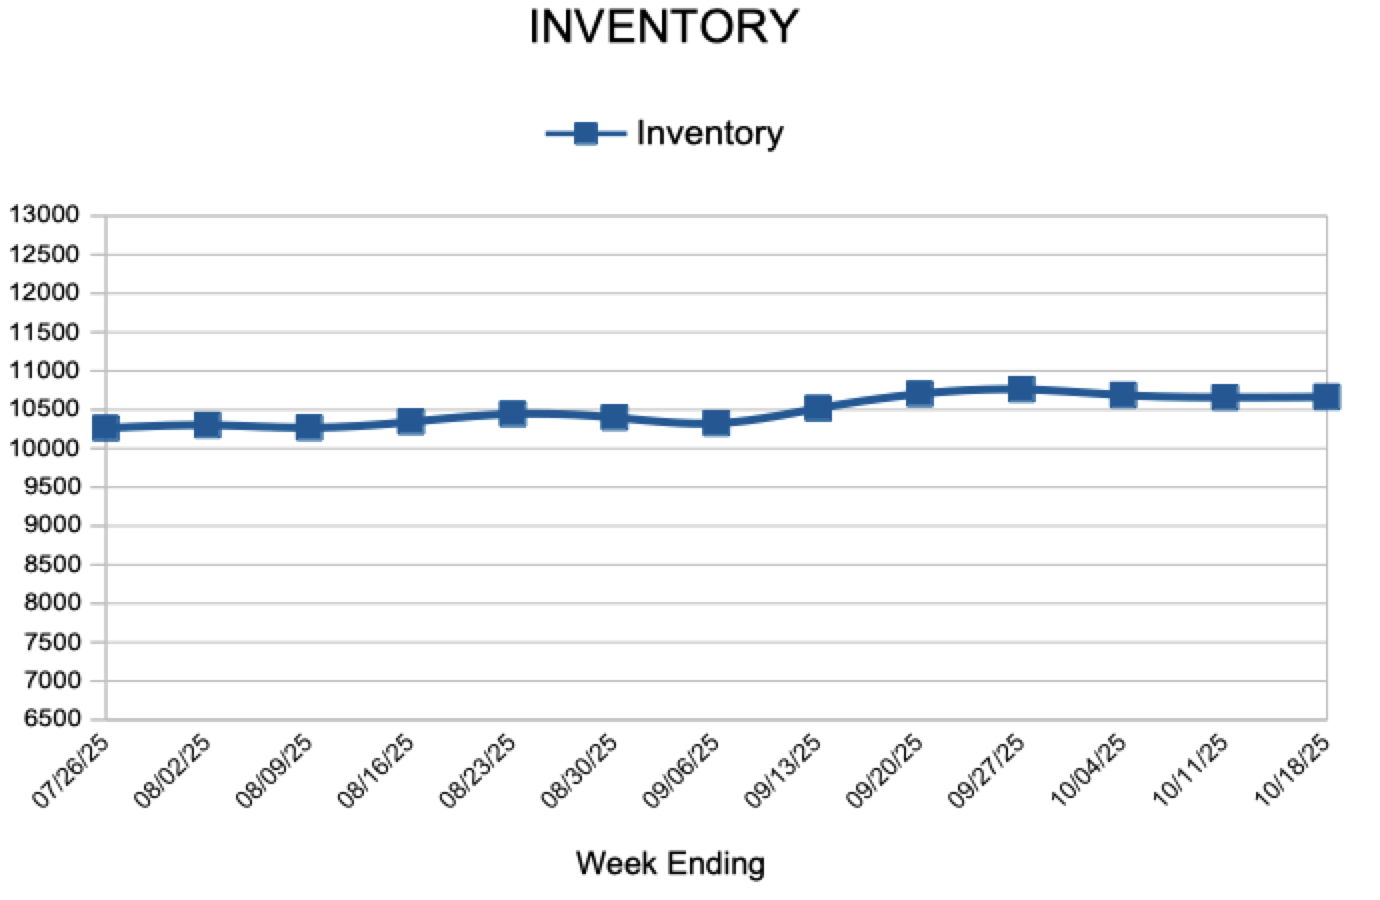
IN THE TWIN CITIES REGION, FOR THE WEEK ENDING NOVEMBER 1:
- New Listings increased 14.2% to 1,197
- Pending Sales decreased 5.5% to 819
- Inventory decreased 0.9% to 10,524
FOR THE MONTH OF SEPTEMBER:
- Median Sales Price increased 2.6% to $390,000
- Days on Market increased 12.8% to 44
- Percent of Original List Price Received decreased 0.1% to 98.4%
- Months Supply of Homes For Sale decreased 3.4% to 2.8
All comparisons are to 2024
Click here for the full Weekly Market Activity Report. From MAAR Market Data News.