Ted Bergstrom

MN Real Estate Team

612.723.5444

Ted@TedBergstrom.com

Weekly Market Report


For Week Ending July 18, 2020

The latest figures released by the Department of Commerce show total housing starts in June rose 17.3% to a seasonally adjusted annual rate of 1.19 million units, with single-family units leading the way with a 17.2% increase to a seasonally adjusted rate of 831,000 per year. With demand for housing strong across most of the nation, this increase in new construction is welcome, but will do little to significantly impact the lack of housing inventory nationwide.

In the Twin Cities region, for the week ending July 18:

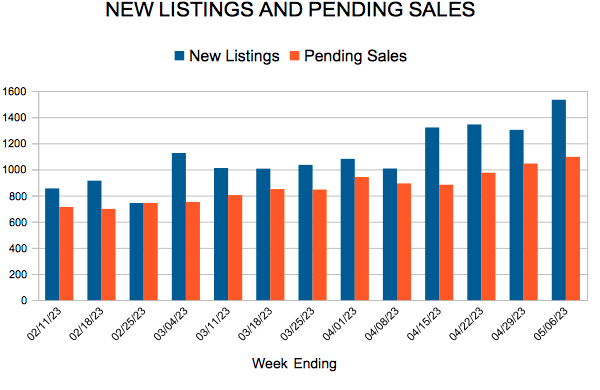
  • New Listings decreased 9.1% to 1,753
  • Pending Sales increased 10.2% to 1,541
  • Inventory decreased 27.2% to 9,339

For the month of June:

  • Median Sales Price increased 5.2% to $304,995
  • Days on Market increased 2.4% to 42
  • Percent of Original List Price Received decreased 0.4% to 99.6%
  • Months Supply of Homes For Sale decreased 29.6% to 1.9

All comparisons are to 2019

Click here for the full Weekly Market Activity Report. From MAAR Market Data News.

Weekly Market Report


For Week Ending July 11, 2020

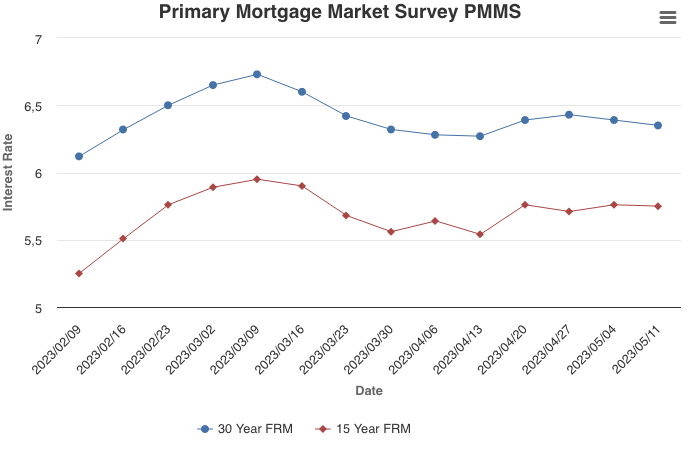
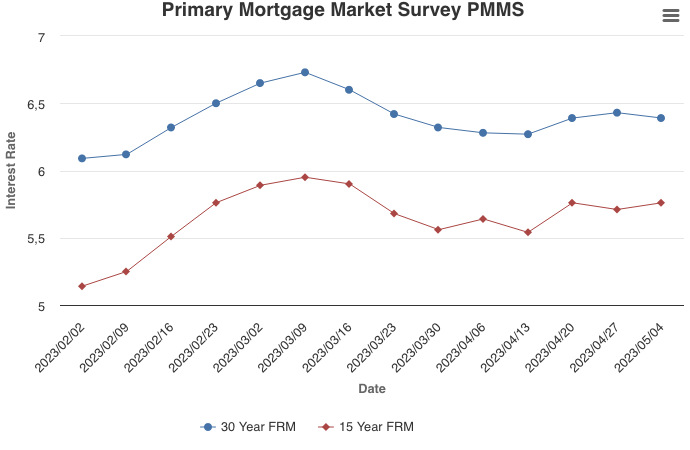
Mortgage rates continue to hit new lows. This week, mortgage giant Freddie Mac reported that rates on a 30-year fixed-rate mortgage fell to a new record low of 3.03% with an average of .8 points. That is down from 3.07% last week and 3.75% from the same week a year ago. Record-low rates are continuing to boost already strong buyer demand throughout most of the country and economists expect rates to continue to remain low in the near future.

In the Twin Cities region, for the week ending July 11:

  • New Listings decreased 18.8% to 1,834
  • Pending Sales decreased 0.5% to 1,507
  • Inventory decreased 25.9% to 9,287

For the month of June:

  • Median Sales Price increased 5.2% to $305,000
  • Days on Market increased 2.4% to 42
  • Percent of Original List Price Received decreased 0.4% to 99.6%
  • Months Supply of Homes For Sale decreased 29.6% to 1.9

All comparisons are to 2019

Click here for the full Weekly Market Activity Report. From MAAR Market Data News.

June signed purchase agreements reach highest level since 2004

New Highs For Showings Suggest Further Strengthening, Though Inventory Still A Challenge

(July 16, 2020) – According to new data from the Minneapolis Area REALTORS® and the Saint Paul Area Association of REALTORS®, market activity in the 16-county Twin Cities metro continued to recover from the April and May declines.

After double-digit declines in April and May, the number of purchase contracts signed in June increased 6.2 percent from last year. That brought the number of pending sales to 6,819 for the month, the highest June figure since 2004. Some of the pent-up demand from April and May was shifted into June instead of being cancelled outright.

Most of the increase was in the single-family segment. Newly built homes also saw a large gain as buyers were eyeing more space and perhaps a second home office, but also found existing options limited. Record low mortgage rates were another motivating factor for buyers—particularly first-time buyers.

“It is still very busy, but there is little inventory,” said Patrick Ruble, president of the St. Paul Area Association of REALTORS®. “Buyers enticed by historically low mortgage rates in April or May can still capitalize on those rates now; however, because there is no inventory we really need to see an increase in listings.”

Sellers are struggling to keep up, though that may be changing. After greater than 20.0 percent declines during April and May, new listings shrank 14.6 percent in June. The share of the list price that sellers received was still down slightly from last year, but at 99.6 percent, it remains at a very high level. The region had 1.8 months of supply in June, indicating a strong and undersupplied sellers’ market. A balanced market has around 5 or 6 months of supply. By contrast, the over $1M luxury segment had more than 11.0 months of supply in June.

“An encouraging showings trend alongside strong demand and a limited supply of homes should continue to support prices,” said Linda Rogers, President of Minneapolis Area REALTORS®. “While still positive, the rate of price growth moderated in May. Now June home price growth is roughly on-pace with the last 12 months.”

The Federal Reserve pushed interest rates on a 30-year fixed mortgage to around 3.0 percent—the lowest figure recorded in more than 50 years. Attractive interest rates can partly offset declines in affordability. Despite that being a motivating factor, the limited supply of homes for sale is one of the biggest challenges for buyers. Sellers are slowly gaining more confidence around health concerns, but a resurgence in COVID-19 cases could dampen that. While condo sales were still lagging, the data shows buyer and seller activity in Minneapolis is comparable to surrounding cities and suburbs.

June 2020 By The Numbers Compared To A Year Ago

  • Sellers listed 7,306 properties on the market, a 14.6 percent decrease from last June
  • Buyers signed 6,819 purchase agreements, up 6.2 percent (6,118 closed sales, down 8.8 percent)
  • Inventory levels fell 29.8 percent to 9,154 units
  • Months Supply of Inventory was down 33.3 percent to8 months (5-6 months is balanced)
  • The Median Sales Price rose 5.2 percent to $305,000
  • Cumulative Days on Market increased 2.4 percent to 41 days, on average (median of 18)
  • Changes in Sales activity varied by market segment
    • Single family sales were up 10.2 percent; condo sales fell 12.6 percent; townhome sales increased 0.4 percent
    • Traditional sales rose 7.1 percent; foreclosure sales dropped 23.2 percent; short sales fell 29.4 percent
    • Previously owned sales were up 5.1 percent; new construction sales climbed 35.2 percent

From The Skinny Blog.

Weekly Market Report


For Week Ending July 4, 2020

With healthy buyer demand and constrained supply, showing and offer activity continue to be high with many properties receiving multiple offers. Holiday weeks often provide a short reprieve from the normal busy summer selling season as buyers and sellers take a few days to focus on festivities before turning their focus back to real estate the following week.

In the Twin Cities region, for the week ending July 4:

  • New Listings increased 20.4% to 1,257
  • Pending Sales increased 17.9% to 1,466
  • Inventory decreased 25.3% to 9,624

For the month of May:

  • Median Sales Price increased 3.5% to $294,900
  • Days on Market decreased 8.9% to 41
  • Percent of Original List Price Received decreased 0.4% to 99.6%
  • Months Supply of Homes For Sale decreased 16.0% to 2.1

All comparisons are to 2019

Click here for the full Weekly Market Activity Report. From MAAR Market Data News.

Weekly Market Report


For Week Ending June 27, 2020

The National Association of REALTORS® shared in their latest REALTORS® Confidence Index Survey of more than 4,000 members that there were nearly three offers for every home sold in May, which is up from a little more than two offers for every sold home in the April survey. Buyer activity, seen in both showings and Pending Sales, has been strong while seller activity, seen in New Listings, has lagged a bit, suggesting that multiple offer situations continue to be common and will likely remain so in the coming weeks.

In the Twin Cities region, for the week ending June 27:

  • New Listings decreased 16.9% to 1,612
  • Pending Sales increased 3.1% to 1,606
  • Inventory decreased 25.0% to 9,705

For the month of May:

  • Median Sales Price increased 3.5% to $294,900
  • Days on Market decreased 8.9% to 41
  • Percent of Original List Price Received decreased 0.4% to 99.6%
  • Months Supply of Homes For Sale decreased 16.0% to 2.1

All comparisons are to 2019

Click here for the full Weekly Market Activity Report. From MAAR Market Data News.

Weekly Market Report


For Week Ending June 20, 2020

Housing starts in May rose 4.3% to an annual rate of 974,000, its first increase since January and up from a five-year low of 934,000 in April. The increase was less than expected by economists but builder permits were up 14.4% for the month to 1.22 million annually, signaling higher housing starts are likely in the near future.

In the Twin Cities region, for the week ending June 20:

  • New Listings decreased 16.4% to 1,728
  • Pending Sales increased 3.4% to 1,594
  • Inventory decreased 22.8% to 9,871

For the month of May:

  • Median Sales Price increased 3.5% to $294,900
  • Days on Market decreased 8.9% to 41
  • Percent of Original List Price Received decreased 0.4% to 99.6%
  • Months Supply of Homes For Sale decreased 16.0% to 2.1

All comparisons are to 2019

Click here for the full Weekly Market Activity Report. From MAAR Market Data News.

Weekly Market Report


For Week Ending June 13, 2020

New unemployment insurance weekly claims declined again this week, coming in at a little over 1.5 million claims. This is down substantially from more than 6 million claims posted per week in late March and early April but still higher than pre-COVID- 19 levels. Nearly 21 million Americans remain unemployed, up from just 1.7 million a year ago. As businesses continue to reopen, new unemployment claims and total unemployed is expected to decline in the coming weeks.

In the Twin Cities region, for the week ending June 13:

  • New Listings decreased 22.0% to 1,648
  • Pending Sales decreased 8.5% to 1,414
  • Inventory decreased 20.7% to 9,901

For the month of May:

  • Median Sales Price increased 3.3% to $294,375
  • Days on Market decreased 8.9% to 41
  • Percent of Original List Price Received decreased 0.4% to 99.6%
  • Months Supply of Homes For Sale decreased 16.0% to 2.1

All comparisons are to 2019

Click here for the full Weekly Market Activity Report. From MAAR Market Data News.

Market activity up in May from previous month, but down from 2019

New highs for showings hint at buyer confidence, but supply questions remain

(June 18, 2020) – According to new data from the Minneapolis Area REALTORS® and the Saint Paul Area Association of REALTORS®, market activity was down from last May but increased from this April.The number of residential showings has reached a new high for the year. The decline in pending sales was about half that of new listings, as buyers were motivated by record-low mortgage rates. Pending sales were down just 2.5 percent in the $350-500K price range but fell 34.8 percent on homes between $750K-1M. For new listings, the reverse was true with the biggest declines in the affordable price range of $150-190K and the smallest drop in new listings for homes over $1M.

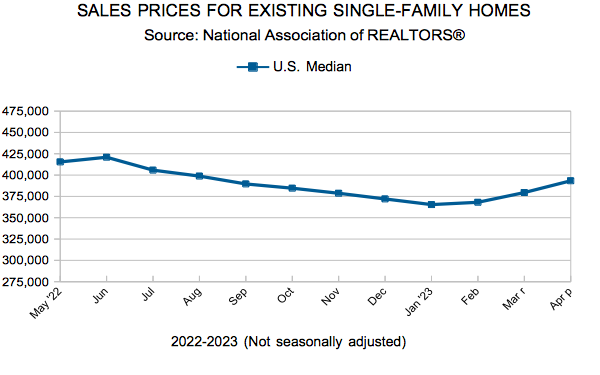
“Activity is moving through the system—fewer April contracts now means fewer closed sales in May,” said Linda Rogers, President of Minneapolis Area REALTORS®. “But smaller declines in May contracts combined with strong showing activity are reasons for cautious optimism.”Home prices rose to about $295K compared to last May, but it was the smallest percentage gain since January 2017. April was the first month on record where the median home price surpassed $300K. Homes also sold more quickly this May than last, as motivated buyers remained committed, but less serious buyers and “lookers” were not as active. The share of their list price that sellers received declined to 99.6 percent from 100.0 percent last May.

“We expected May to be a slight improvement from April and so far that is mostly true,” said Patrick Ruble, President of the St. Paul Area Association of REALTORS®. “Not only is showing activity displaying some strength, but the home buyers and sellers we work with are starting to feel more confident as well. Rates are at historic lows and should remain low throughout the year.”

Showing activity rose by 11.0 percent from the most recent week compared to the week prior and has reached new highs. The economic toll impacted market segments differently. First-time buyers are more likely to be impacted by job losses in the leisure, hospitality or retail space, while those shopping in the luxury brackets may be impacted by turmoil in equity and energy markets. The middle-market ranges are outperforming, helped along by professionals who can work from home. Given the lack of supply—especially close to the core cities—and price points in the low $400s, the new home market is more stable than the existing resale market.

Mortgage rates on a 30-year fixed loan are around 3.25 percent—the lowest they have ever been. While recessions can pause market activity, they typically only have a minor impact on home prices. A persistently undersupplied market—particularly for affordable homes—may help prices stay afloat.

May 2020 by the numbers compared to a year ago

  • Sellers listed 7,199 properties on the market, a 24.1 percent decrease from last May
  • Buyers signed 5,828 purchase agreements, down 13.9 percent (4,728 closed sales, down 22.4 percent)
  • Inventory levels declined 20.3 percent to 9,744 units
  • Months Supply of Inventory was down 20.0 percent to0 months (5-6 months is balanced)
  • The Median Sales Price rose 3.5 percent to $294,900
  • Cumulative Days on Market decreased 8.9 percent to 41 days, on average (median of 16)
  • Changes in Sales activity varied by market segment
    • Single family sales fell 9.2 percent; condo sales were down 38.6 percent; townhome sales declined 18.4 percent
    • Traditional sales decreased 13.2 percent; foreclosure sales dropped 4.3 percent; short sales fell 30.8 percent
    • Previously owned sales were down 13.8 percent; new construction sales declined 0.5 percent

From The Skinny Blog.