Ted Bergstrom
MN Real Estate Team
612.723.5444
Ted@TedBergstrom.com
Facebook
Linkedin
Instagram
Menu
Home
Listings
Search
Resources
Sellers
Buyers
About
Contact
Cabin
Home
Listings
Search
Resources
Sellers
Buyers
About
Contact
Cabin
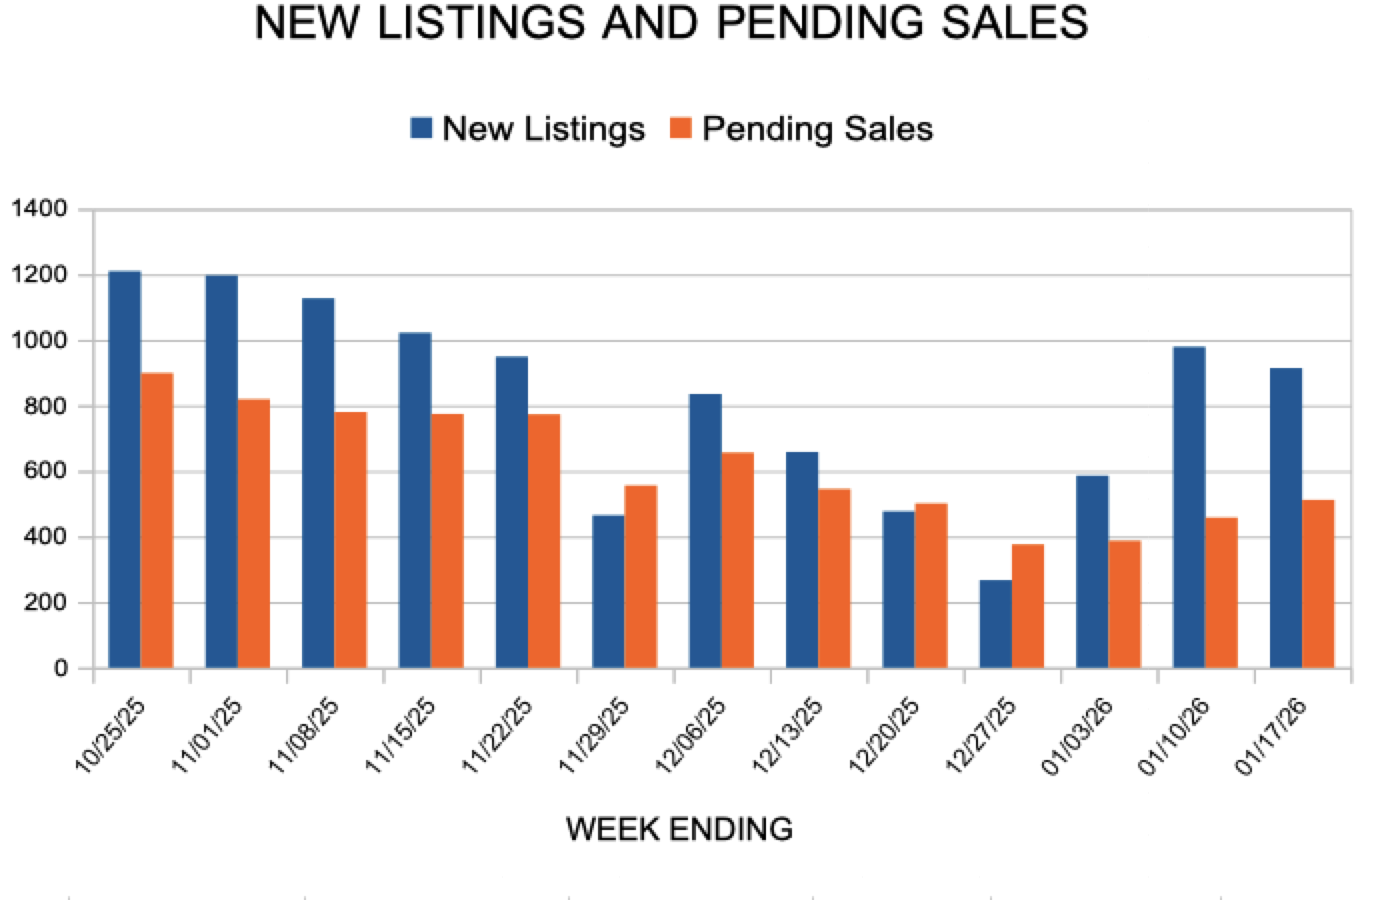
New Listings and Pending Sales
January 26, 2026
by
Ted Bergstrom
Leave a Comment
New Listings and Pending Sales
January 26, 2026
by
Ted Bergstrom
Leave a Comment
New Listings and Pending Sales
January 26, 2026
by
Ted Bergstrom
Leave a Comment
New Listings and Pending Sales
January 26, 2026
by
Ted Bergstrom
Leave a Comment
New Listings and Pending Sales
January 26, 2026
by
Ted Bergstrom
Leave a Comment
New Listings and Pending Sales
January 26, 2026
by
Ted Bergstrom
Leave a Comment
New Listings and Pending Sales
January 26, 2026
by
Ted Bergstrom
Leave a Comment
New Listings and Pending Sales
January 26, 2026
by
Ted Bergstrom
Leave a Comment
New Listings and Pending Sales
January 26, 2026
by
Ted Bergstrom
Leave a Comment
New Listings and Pending Sales
January 26, 2026
by
Ted Bergstrom
Leave a Comment
« Previous Page
1
…
6
7
8
9
10
…
41
Next Page »