New Listings and Pending Sales
(June 16, 2022) – According to new data from Minneapolis Area REALTORS® and the Saint Paul Area Association of REALTORS®, the Twin Cities metro area ended the month of May with 6,797 homes, 5.3 percent more homes than last May. This is the first year-over-year inventory increase since March of 2020.
Home Prices & Inventory
Inventory growth in the Twin Cities real estate market has been rare over the last 13 years. Despite record sales in 2021, home buyers were met with fewer listings from which to choose. Since the Great Recession, there have only been three periods with multiple consecutive months of year-over-year supply growth. If continued, the 5.3 percent inventory growth in May could hint at a new trend. Meanwhile the median home price rose 9.0 percent to $375,000. While this does amount to a record high, it’s likely June and July will exceed that level. The housing affordability index reacted to higher prices and rates with a reading of 94, meaning the median income was 94.0 percent of the necessary income needed to qualify for the median priced home under current interest rates. Given more listings and fewer sales, a loosening in inventory could cap price gains, but that takes time to play out and prices are unlikely to soften in the short term. Meanwhile, the metro sits at 1.3 month’s supply of inventory, 18.2 percent more than the year prior. A balanced market has four to six months’ supply. “There’s a sense out there that things are rebalancing somewhat,” said Denise Mazone, President of Minneapolis Area REALTORS®. “But it’s important to remember that we have a long way to go before we’re in oversupply territory so prices should remain firm for now.”
Listings & Sales
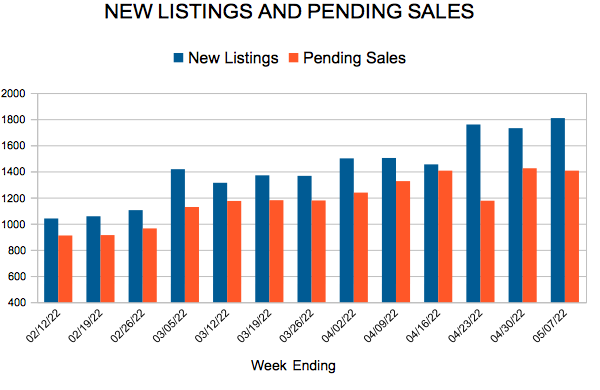
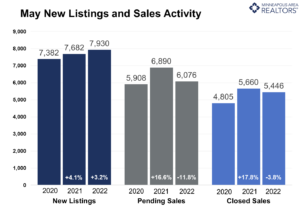
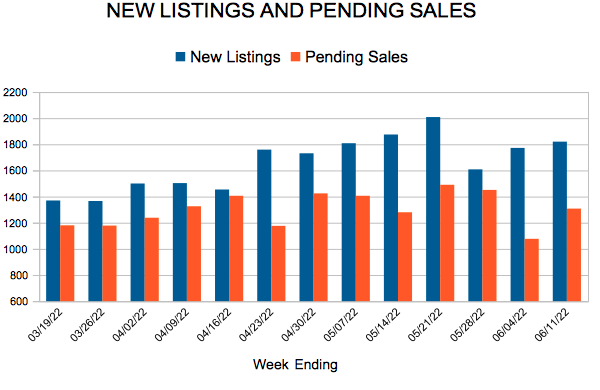
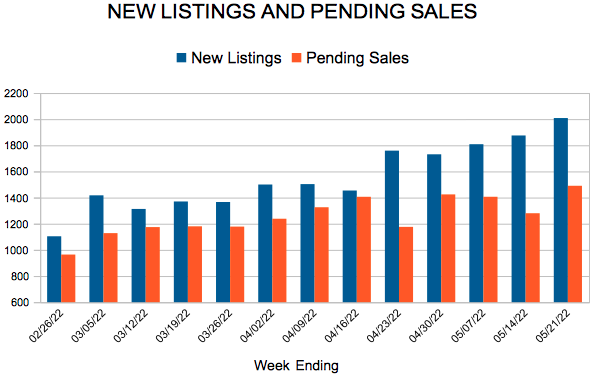
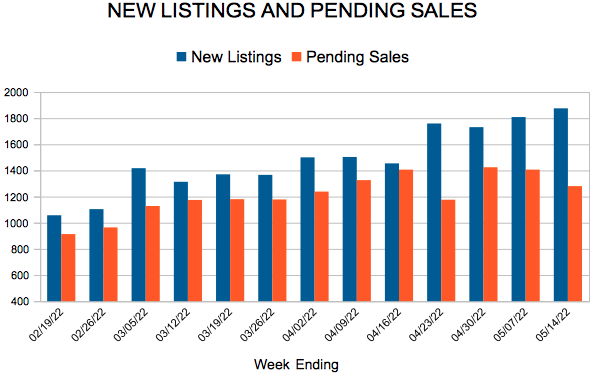
The Twin Cities saw increased seller activity in May for the first time this year—a possible indication of a rebalancing market. New Listings rose 3.2 percent to 7,930 homes last month. Growth in new listings is a contributor to higher inventory levels as is the partly rate-driven decline in buyer activity. Pending sales fell 11.8 percent in May as buyers signed purchase agreements on 6,076 homes. Declining year-over-year demand has been a theme all year since we’ve been comparing to the extremely strong 2021 market. Compared to 2020, pending sales were up 4.8 percent. “We may not have the same frenzy as last year, but REALTORS® are still busy compared to pre-pandemic levels,” according to Mark Mason, President of the Saint Paul Area Association of REALTORS®. “Listings are still selling quickly, even with record prices and higher rates.” Half of all homes went under contract in under 7 days, which is even with the year prior. The good news for sellers is that—despite a cooling in demand—buyers offered 4.1 percent over list price on average, a small increase compared to last May.
Location & Property Type
Market activity varies by area, price point and property type. New home sales rose 6.7 percent while existing home sales were down 3.2 percent. Single family sales fell 4.1 percent, condo sales declined 3.8 percent and townhome sales were up 4.0 percent. Sales in Minneapolis decreased 7.0 percent while Saint Paul sales fell 3.5 percent. Cities like Vadnais Heights, Buffalo, and Champlin saw the largest sales gains while Ramsey, St. Michael, and Andover had lower demand than last year.
May 2022 Housing Takeaways (compared to a year ago)


(May 16, 2022) – According to new data from Minneapolis Area REALTORS® and the Saint Paul Area Association of REALTORS®, the Twin Cities metro area saw rising prices, fast market times and strong offers—often over asking price—during April. But rising mortgage rates have forced the affordability index below 100 for the first time since at least 2004.
HOME PRICES & INVENTORY
While the median home price rose 10.0 percent to reach a new record of $370,000—and will likely do so again over the next couple months—declines in affordability have continued to weigh on some buyers who are already fatigued from writing several offers. Historically low interest rates have been offsetting the effect of rising prices on monthly mortgage payments. But that’s quickly changing as the Federal Reserve races to combat high inflation by raising rates. Even so, the long-term average 30-year fixed mortgage rate is about 8.0 percent, above where we currently stand at around 5.2 percent. The affordability index fell to 95, meaning the median income was 95.0 percent of the necessary income needed to qualify for the median priced home under prevailing interest rates.
Despite affordability concerns, the supply-demand imbalance will likely keep prices firm. Some buyers may need to re-evaluate their target price to keep monthly payments at a level they’re comfortable with. We ended April with 5,758 homes on the market, 9.2 percent fewer than April 2021 and the twenty-fifth straight month of year-over-year inventory declines. This amounts to just 1.1 months’ supply of inventory, giving sellers the upper hand (a balanced market has four to six months’ supply). “Even with several justifiable concerns, this market continues to outperform,” according to Mark Mason, President of the Saint Paul Area Association of REALTORS®.
LISTINGS & SALES
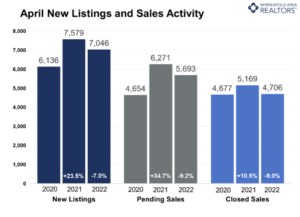
Due to several factors, buyer activity has moderated somewhat. First, we’re comparing against the highs of the Covid housing craze from last spring. Second, inventory is even lower and further pressuring sales. Third, rising rates have likely taken some buyers out of the market. Buyers signed 9.2 percent fewer purchase agreements than April of last year and closed on 9.0 percent fewer homes. Sellers listed 7.0 percent fewer homes than last April. Sellers may feel attached to their interest rate and reluctant to list their homes to avoid higher interest rates.
While still high, it’s possible inflation has peaked. Financial experts report that annual inflation moderated for the first time in months. “It’s the rates and payment piece that is of concern to many of the buyers I work with,” said Denise Mazone, President of Minneapolis Area REALTORS®. “The reality is that people will need to buy and sell homes in any environment, but this really puts pressure on those who are on a budget.” Listings spent 9.7 percent fewer days on market than April 2021 on average. But the median days on market showed half of all homes went under contract in under 8 days, which is even with last April’s pace. This could be a sign of stabilization, yet sellers accepted offers 3.8 percent higher than their list price, on average.
LOCATION & PROPERTY TYPE
Market activity varies by area, price point and property type. New and existing home sales fell 3.5 and 8.0 percent, respectively. Single family sales fell 8.3 percent while condo sales rose 1.5 percent. Sales in Minneapolis declined 3.2 percent while Saint Paul sales fell 17.7 percent. The Longfellow, University, Summit Hill and West Seventh neighborhoods saw the largest sales gains while Hopkins, Mounds View, Wyoming and Somerset also had significant demand increases.
APRIL 2022 BY THE NUMBERS (COMPARED TO A YEAR AGO)
April 2022 HOUSING CHARTS
From The Skinny Blog.