For Week Ending May 18, 2024
According to the 2021 American Housing Survey, approximately 10.2 million households bought and moved to a new home in the two years preceding the date the survey was conducted. Of those, 40% of buyers purchased their first home, and 7% of buyers purchased a newly built home. First-time buyers had a median age of 33 years and a median income of $90,000, while new-home buyers had a median age of 45 years and a median income of $112,100. The median age of all homebuyers was 41 years, with a median income of $97,700.
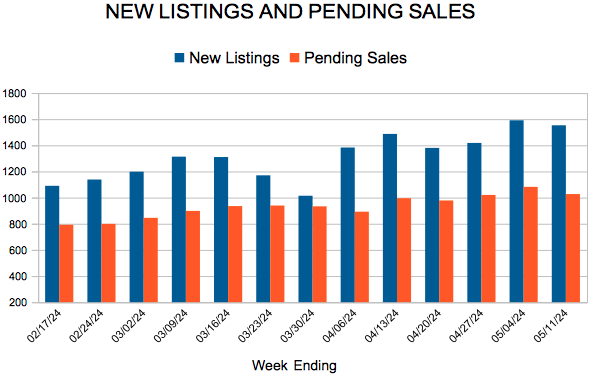
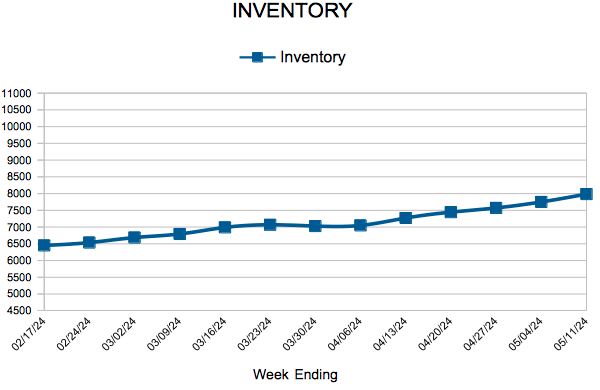
IN THE TWIN CITIES REGION, FOR THE WEEK ENDING MAY 18:
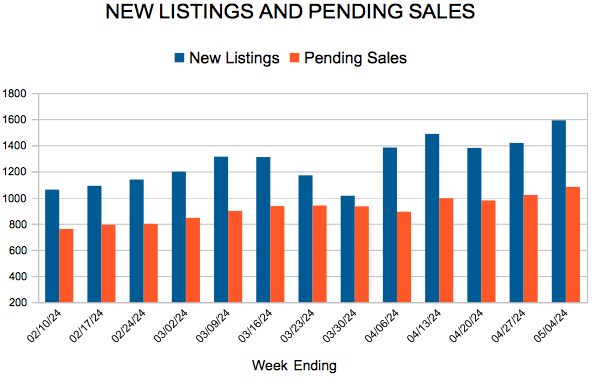
- New Listings decreased 2.7% to 1,646
- Pending Sales decreased 4.9% to 1,028
- Inventory increased 16.9% to 8,234
FOR THE MONTH OF APRIL:
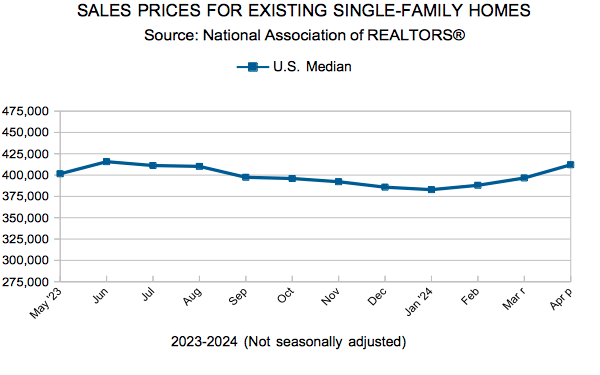
- Median Sales Price increased 4.1% to $385,000
- Days on Market remained flat at 46
- Percent of Original List Price Received decreased 0.2% to 99.9%
- Months Supply of Homes For Sale increased 23.5% to 2.1
All comparisons are to 2023
Click here for the full Weekly Market Activity Report. From MAAR Market Data News.