Ted Bergstrom

MN Real Estate Team

612.723.5444

Ted@TedBergstrom.com

Weekly Market Report

For Week Ending May 15, 2021

Despite elevated demand for housing, construction of new homes fell in April, with the U.S. Department of Housing and Urban Development and the U.S. Census Bureau reporting a 9.5% decrease in housing starts from the previous month. Rising building costs continue to hinder affordability and inventory for many homebuyers, although shortages in labor, issues with the U.S. supply chain, and lasting impact from late winter storms have also contributed to the decline in new construction activity, putting some projects on pause for the time being.

In the Twin Cities region, for the week ending May 15:

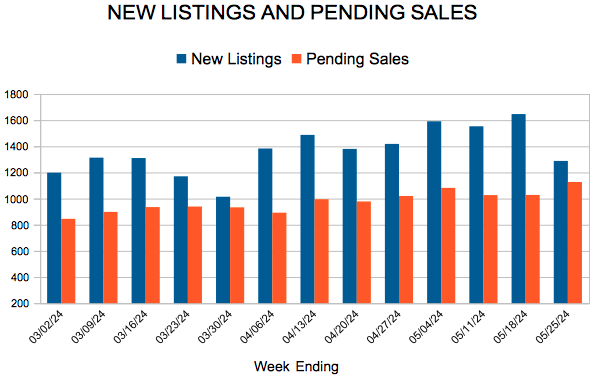
  • New Listings increased 13.8% to 1,926
  • Pending Sales increased 13.5% to 1,573
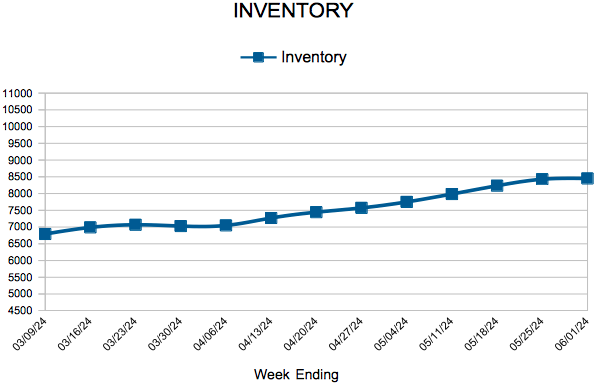
  • Inventory decreased 45.8% to 5,765

For the month of April:

  • Median Sales Price increased 10.2% to $336,250
  • Days on Market decreased 34.0% to 31
  • Percent of Original List Price Received increased 3.4% to 103.3%
  • Months Supply of Homes For Sale decreased 52.4% to 1.0

All comparisons are to 2020

Click here for the full Weekly Market Activity Report. From MAAR Market Data News.

Supply Rebounds from 2020 Levels While Demand Continues to Rise

Market times fastest in 14 years amid record home prices in the Twin Cities

(May 17, 2021) – According to new data from the Minneapolis Area REALTORS® and the Saint Paul Area Association of REALTORS®, seller activity in April was up 21.7 percent compared to last year, when new listings dipped partly due to COVID-19. The number of homes that were put on the market in April is comparable to pre-pandemic levels in 2019 and 2018.

The median price of a home in the 16-county Twin Cities metro rose to $337,000, a 10.5 percent increase from last April and a new record high for the region. Even so, half of homes go under contract within 8 days of listing, the fastest time in at least 14 years. This is a clear indication that the metro is still in need of a greater housing supply to keep up with rising demand.

“It’s promising to see improvements in housing supply, but it’s clear that we aren’t out of the woods just yet,” said Todd Walker, President of Minneapolis Area REALTORS®. “In time, more potential sellers will be encouraged to list, enticed by rising prices and more inventory. In the meantime, developers need incentives to expand new inventory, particularly in affordable price ranges.”

Although supply rebounded to that of pre-pandemic levels in April, the increase in demand was even greater. Pending sales are up 34.0 percent from April of last year and exceed 2019 numbers by 8.2 percent. With 5,619 homes for sale, the Twin Cities currently has 1.0 month’s supply of inventory. Typically, 4-6 months is considered a balanced market.

“Buyers still benefit from record low mortgage rates at around 3.0 percent,” according to Tracy Baglio, President of the Saint Paul Area Association of REALTORS®. “Although a limited supply is driving prices higher, low rates are a strong incentive to offer a competitive bid for a home.”

Activity varies by area, price point and property type. Sales of single-family homes were up 32.0 percent in Minneapolis and 14.8 percent in St. Paul, suggesting demand remains strong in the core cities. Across the 16-county Twin Cities region condo sales rose 50.6 percent, outpacing single-family and townhomes. Sales on previously owned homes rose 10.3 percent while new construction rose 2.0 percent. Luxury property sales ($1M+) are up 180.6 percent from last April, 90.6 percent from April 2019.

April 2021 by the numbers compared to a year ago

  • Sellers listed 7,468 properties on the market, a 21.7 percent increase from last April
  • Buyers signed 6,220 purchase agreements, up 33.6 percent (5,088 closed sales, up 8.8 percent)
  • Inventory levels fell 45.8 percent to 5,619 units
  • Month’s Supply of Inventory was down 52.4 percent to 1.0 month (4-6 months is balanced)
  • The Median Sales Price rose 10.5 percent to $337,000
  • Days on Market decreased 34.0 percent to 31 days, on average (median of 8 days, down 52.9 percent)
  • Changes in Sales activity varied by market segment
    • Single family sales were up 3.6 percent; condo sales rose 50.6 percent; townhome sales increased 17.0 percent
    • Traditional sales rose 10.1 percent; foreclosure sales were down 44.1 percent; short sales fell 69.2 percent
    • Previously owned sales were up 10.3 percent; new construction sales climbed 2.0 percent

From The Skinny Blog.

Weekly Market Report

For Week Ending May 8, 2021

The Mortgage Bankers Association’s latest National Delinquency Survey found the seasonally adjusted delinquency rate of one-to-four unit residential properties decreased to 6.38 percent of all loans outstanding in Q1 2021, which is 35 basis points lower than Q4 2020 but still 202 basis points higher than the same time last year. The COVID-19 induced delinquency rate peaked in Q2 2020 at 8.22 percent and over the last three quarters has experienced the quickest decline in the history of the survey. Although delinquencies remain elevated, the continued declines are encouraging and are expected to continue.

In the Twin Cities region, for the week ending May 8:

  • New Listings increased 0.7% to 1,829
  • Pending Sales increased 24.5% to 1,571
  • Inventory decreased 47.0% to 5,524

For the month of April:

  • Median Sales Price increased 10.5% to $337,000
  • Days on Market decreased 34.0% to 31
  • Percent of Original List Price Received increased 3.5% to 103.4%
  • Months Supply of Homes For Sale decreased 52.4% to 1.0

All comparisons are to 2020

Click here for the full Weekly Market Activity Report. From MAAR Market Data News.

Weekly Market Report

For Week Ending May 1, 2021

The National Association of Home Builders’ latest Housing Trends Report found that in Q1 2021, 16% of American adults were looking to purchase a home in the next 12 months, up from 10% from a year ago and now at the highest level since Q1 2018. The Millennial generation saw the largest change in expectations year over year, with 32% planning to buy in the next 12 months, double the levels seen in Q1 2020.

In the Twin Cities region, for the week ending May 1:

  • New Listings increased 10.8% to 1,730
  • Pending Sales increased 25.5% to 1,534
  • Inventory decreased 47.8% to 5,406

For the month of March:

  • Median Sales Price increased 10.5% to $328,231
  • Days on Market decreased 36.1% to 39
  • Percent of Original List Price Received increased 2.7% to 101.9%
  • Months Supply of Homes For Sale decreased 47.4% to 1.0

All comparisons are to 2020

Click here for the full Weekly Market Activity Report. From MAAR Market Data News.