New Listings and Pending Sales
(June 15, 2023) – According to new data from Minneapolis Area REALTORS® and the Saint Paul Area Association of REALTORS®, home prices dipped slightly from last May. Both buyer and seller activity were also lower compared to last year.
Sales & Prices
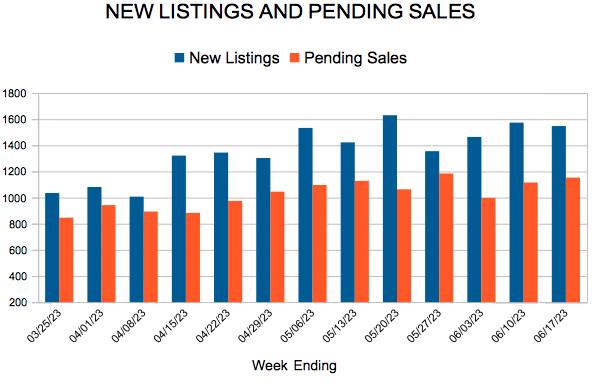
Prices were flat in April and down slightly in May. As in April, May sellers still accepted offers above their list price despite a decline in sales—a dynamic that reflects the persistently tight balance between supply and demand even in light of rising mortgage rates. While some sellers are still seeing multiple offers on well-presented listings, the offers were closer to 1.0 percent over list price versus 4.0 percent over list price last May. With half the homes selling in under 13 days, market times are up as demand has waned. And yet, homes are still selling faster than in May of 2019 and 2020.
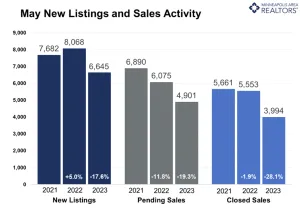
Pending sales dipped 19.3 percent; closed sales fell 28.1 percent. Condo sales showed the largest drop while townhomes saw the smallest decline. Single family homes sold at a median of $405,000, townhomes at $311,000 and condos at $205,000. New home sales were flat while existing home sales were down. New homes sold for $461,000 while existing homes sold for $355,000. Sales under $500,000 decreased 20.4 percent while sales over $1M fell just 6.6 percent.
Home prices are up 25.5 percent since May 2020, but down 1.3 percent from May 2022. “It’s important to keep things in perspective,” said Jerry Moscowitz, President of Minneapolis Area REALTORS®. “The median price simply reflects the middle or typical home selling, but every home is unique. In some ways, this pause gives buyers some room to be more selective on the listings that really stand out.”
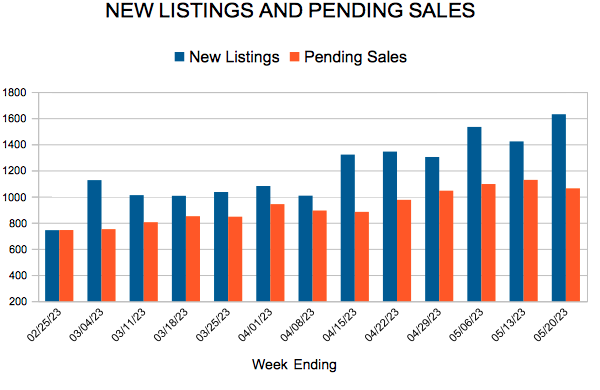
Listings and Inventory
In May, sellers brought 17.6 percent fewer new listings online than last year—the smallest decline in four months. Inventory levels slid 9.0 percent lower. Some sellers are choosing to stay put and wait instead of selling for a lower price. Most sellers are also buyers and are reluctant to trade away their 3.0 percent interest rate for 6.8 percent. “While rates are surely a factor in decision-making, don’t lose sight of other factors like changes in lifestyle, a new job, growing or shrinking households, separations and so on,” said Brianne Lawrence, President of the Saint Paul Area Association of REALTORS®. “Economists’ interest rate forecasts vary widely; nobody knows what will happen. If you buy and rates go down you can refinance, if they go up, you’ll be glad you didn’t wait. We’re still below the average 30-year mortgage interest rate over the last 50 years.”
Sellers are also still getting good offers fairly quickly. At a median of 13 days, homes are still selling even faster than in May 2020—there are just fewer sales. But, there are also fewer listings. Both supply and demand downshifting together means the balance between buyer and seller activity has remained tight. And those sellers accepted offers at 101.1 percent of their list price—down from 104.1 percent from last May but clearly still a strong figure. The Twin Cities metro remains a seller’s market, just not to the same degree as last year. The 1.8 months supply of inventory for May was up 28.6 percent. Typically 4-6 months of supply are needed to achieve a balanced, neutral market.
Location & Property Type
Market activity varies by area, price point and property type. New home sales rose 34.6 percent while existing home sales were down 23.0 percent. Single family sales fell 23.6 percent, condo sales declined 8.5 percent and townhome sales were down 3.9 percent. Sales in Minneapolis decreased 13.1 percent while Saint Paul sales fell 29.8 percent. Cities such as Watertown, Medina, Corcoran, Dayton and Shakopee saw the largest sales gains while Buffalo, Monticello, Cambridge and Zimmerman all had notably lower demand than last year.
For more information on weekly and monthly housing numbers visit www.mplsrealtor.com or www.spaar.com
May 2022 Housing Takeaways (compared to a year ago)
(May 17, 2023) – According to new data from Minneapolis Area REALTORS® and the Saint Paul Area Association of REALTORS®, home prices dipped slightly from last April. Both buyer and seller activity were also lower compared to last year.
Sales & Prices
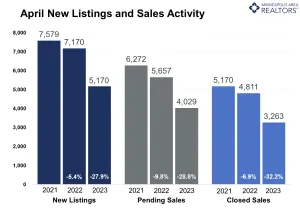
Prices were flat in March and down less than 1.0 percent in April. Despite a slight softening in prices, sellers were still getting offers above their list price, on average (100.1 percent) despite a 28.8 percent decline in sales. These two dynamics seem to portray conflicting pictures. While still present, bidding wars this year haven’t been as extreme as they have over the last couple years. Luxury market activity also cooled slightly more than the rest of the market—though it’s too early to label this a trend. Townhomes tend to sell for about 25.0 percent less than single family homes and made up the largest share of overall closed sales since 2006. This is mostly due to sales in other segments cooling faster than townhomes, but still impacts overall prices.
Home prices are up 28.1 percent since March 2020 but down 0.7 percent from April 2022. “Homeowners sometimes panic when prices soften while buyers often rejoice,” said Jerry Moscowitz, President of Minneapolis Area REALTORS®. “But it’s important to remember that it simply reflects the cross section of homes selling and doesn’t necessarily affect your home’s value. That’s why home buyers should have at least a 5-7 year timeframe.” Sellers are also still getting solid offers in a reasonable timeframe. Some buyers are choosing smaller homes with fewer bedrooms to contain their monthly mortgage payments. At a median of 17 days, homes are still selling as quickly as they did in April 2020. There are just fewer of those sales. But there are also fewer listings. Both supply and demand downshifting together means the balance between buyer and seller activity remains tight as the market remains undersupplied.
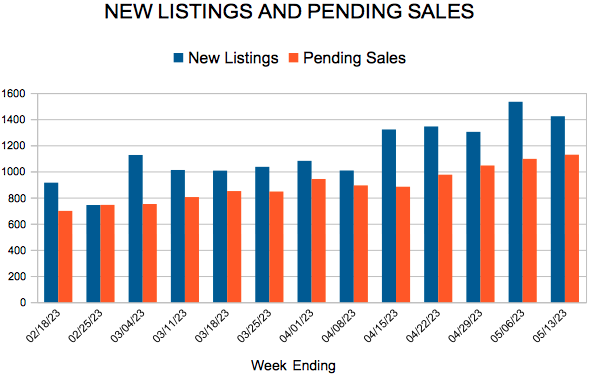
Listings and Inventory
In April, sellers brought 5,170 new listings online or 27.9 percent fewer than last year. Inventory levels trickled 4.5 percent lower. Some sellers are choosing to stay put and wait instead of selling for a lower price. Most sellers are also buyers and higher mortgage rates have harmed affordability significantly. “Make no mistake: multiple offers are still happening, and some properties are selling in a few days or less for well over asking,” said Brianne Lawrence, President of the Saint Paul Area Association of REALTORS®. “But this new environment means buyers are being more selective and budget minded.”
The Twin Cities metro is still a seller’s market, just not to the same degree as last year. April’s months supply of inventory was up an even 25.0 percent. That meant we had 1.5 months’ supply of inventory at month-end. Typically 4-6 months of supply are needed to reach a balanced, neutral market.
Location & Property Type
Market activity varies by area, price point and property type. New home sales rose 20.0 percent while existing home sales were down 32.9 percent. Single family sales fell 31.5 percent, condo sales declined 36.1 percent and townhome sales were down 14.4 percent. Sales in Minneapolis decreased 36.4 percent while Saint Paul sales fell 28.6 percent. Cities like North Branch, White Bear Township, Watertown and Mahtomedi saw the largest sales gains while Carver, New Brighton, North St. Paul, Hugo and Lake Elmo all had notably lower demand than last year.
April 2022 Housing Takeaways (compared to a year ago)

Licensed In Minnesota
All information deemed reliable but not guaranteed and should be independently verified.