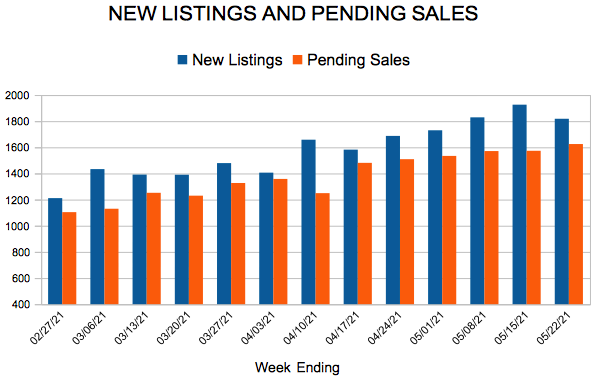
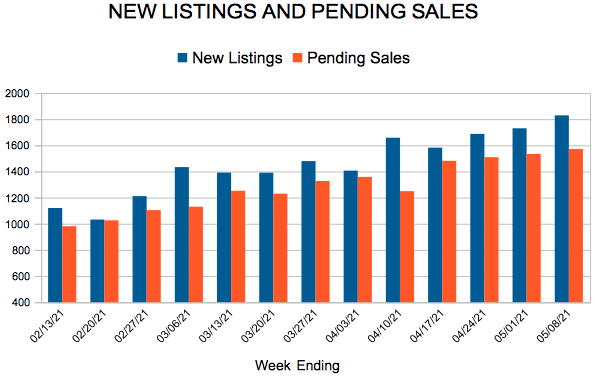
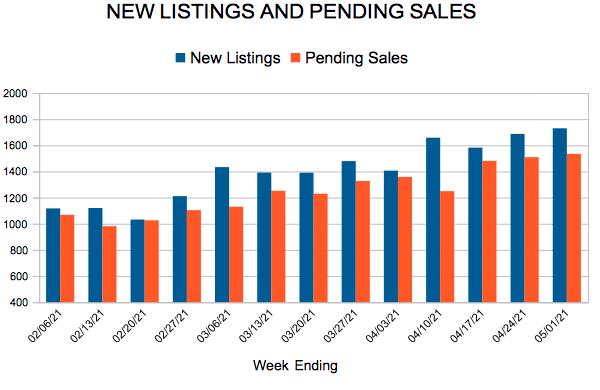
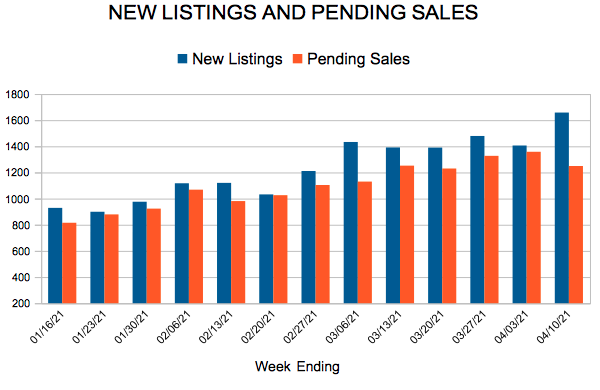
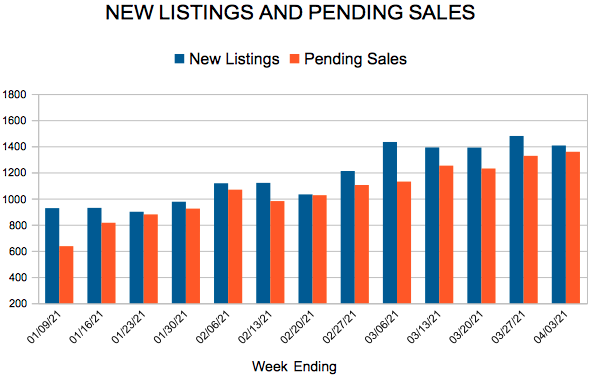
New Listings and Pending Sales
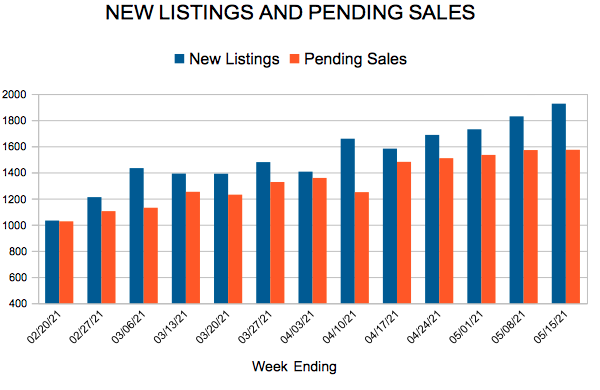
(May 17, 2021) – According to new data from the Minneapolis Area REALTORS® and the Saint Paul Area Association of REALTORS®, seller activity in April was up 21.7 percent compared to last year, when new listings dipped partly due to COVID-19. The number of homes that were put on the market in April is comparable to pre-pandemic levels in 2019 and 2018.
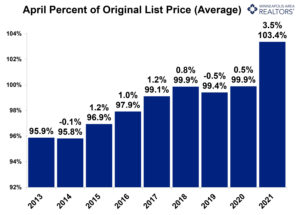
The median price of a home in the 16-county Twin Cities metro rose to $337,000, a 10.5 percent increase from last April and a new record high for the region. Even so, half of homes go under contract within 8 days of listing, the fastest time in at least 14 years. This is a clear indication that the metro is still in need of a greater housing supply to keep up with rising demand.
“It’s promising to see improvements in housing supply, but it’s clear that we aren’t out of the woods just yet,” said Todd Walker, President of Minneapolis Area REALTORS®. “In time, more potential sellers will be encouraged to list, enticed by rising prices and more inventory. In the meantime, developers need incentives to expand new inventory, particularly in affordable price ranges.”
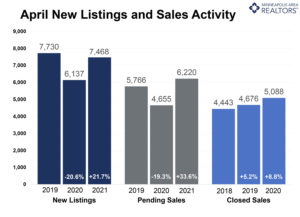
Although supply rebounded to that of pre-pandemic levels in April, the increase in demand was even greater. Pending sales are up 34.0 percent from April of last year and exceed 2019 numbers by 8.2 percent. With 5,619 homes for sale, the Twin Cities currently has 1.0 month’s supply of inventory. Typically, 4-6 months is considered a balanced market.
“Buyers still benefit from record low mortgage rates at around 3.0 percent,” according to Tracy Baglio, President of the Saint Paul Area Association of REALTORS®. “Although a limited supply is driving prices higher, low rates are a strong incentive to offer a competitive bid for a home.”
Activity varies by area, price point and property type. Sales of single-family homes were up 32.0 percent in Minneapolis and 14.8 percent in St. Paul, suggesting demand remains strong in the core cities. Across the 16-county Twin Cities region condo sales rose 50.6 percent, outpacing single-family and townhomes. Sales on previously owned homes rose 10.3 percent while new construction rose 2.0 percent. Luxury property sales ($1M+) are up 180.6 percent from last April, 90.6 percent from April 2019.
April 2021 by the numbers compared to a year ago
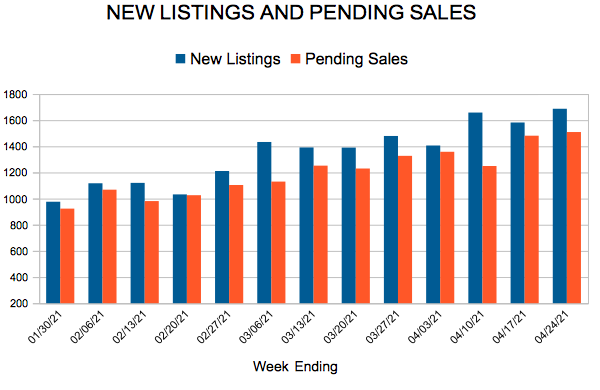
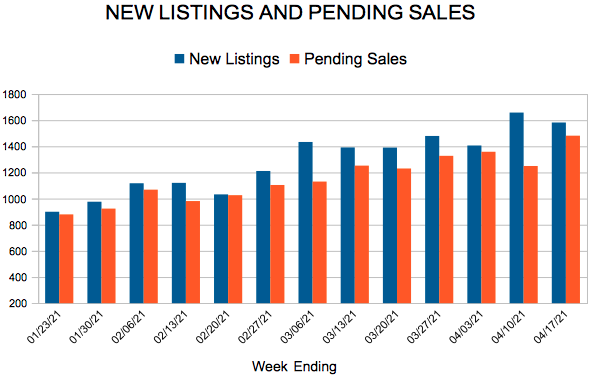
Inventory hits an 18-year low with buyers competing for fewer listings
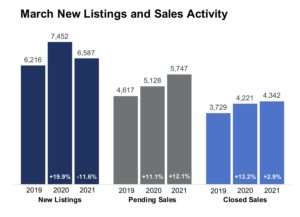
(April 16, 2021) – According to new data from the Minneapolis Area REALTORS® and the Saint Paul Area Association of REALTORS®, the median price of a home in the 16-county Twin Cities metro increased 10.3 percent from last March to a record high of $327,500. Prices were driven in part by a lack of supply.
The number of homes for sale at the end of March was half of what was available a year ago. That marks an 18-year low and amounts to 0.9 months of supply. A balanced market typically has 4-6 months of supply. Market times shrank 37.7 percent to 38 days and multiple offers remain commonplace.
“Demand is still growing faster than supply,” according to Tracy Baglio, President of the Saint Paul Area Association of REALTORS®. “With less than one month of supply, buyers must be patient and understand they may lose out on a few bids before an offer is accepted. Be ready to act fast.”
Sellers listed 11.6 percent fewer homes than March 2020, offering little relief to buyers eager for more options. However, sales activity climbed above year-ago levels for the tenth straight month. Buyers continue to be motivated by attractive mortgage rates, a healing labor market and a desire for more space.
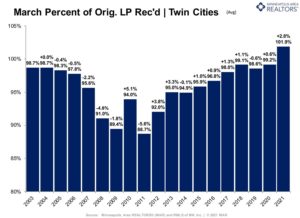
“On top of lightning-fast market times, those who choose to sell their home are often rewarded with offers at or above asking price,” said Todd Walker, President of Minneapolis Area REALTORS®. “For buyers, that means writing strong, straightforward offers right away. For sellers, it means their listings will stand out and will likely sell quickly at full price or better.”
Activity varies by area, price point and property type. Sales were up 31.9 percent in Minneapolis and 9.5 percent in St. Paul, suggesting demand remains strong in the core cities. Condos sales rose 31.7 percent, outpacing single-family and townhomes. New construction sales rose 25.5 percent while previously owned homes rose 0.7 percent. Sales of luxury properties ($1M+) have been soaring—up 70.9 percent from last March.
March 2021 by the numbers compared to a year ago

Licensed In Minnesota
All information deemed reliable but not guaranteed and should be independently verified.