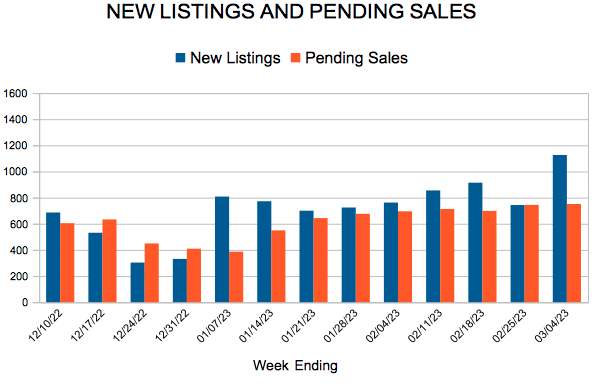
New Listings and Pending Sales
(April 14, 2023) – According to new data from Minneapolis Area REALTORS® and the Saint Paul Area Association of REALTORS®, home prices flattened out and held steady from last March. The metro’s median sales price stands at $355,000. Buyer and seller activity are still down around 25.0 percent from year-ago levels.
Sales & Listings
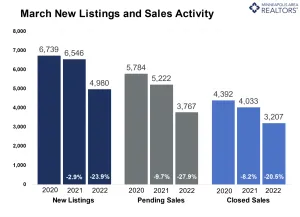
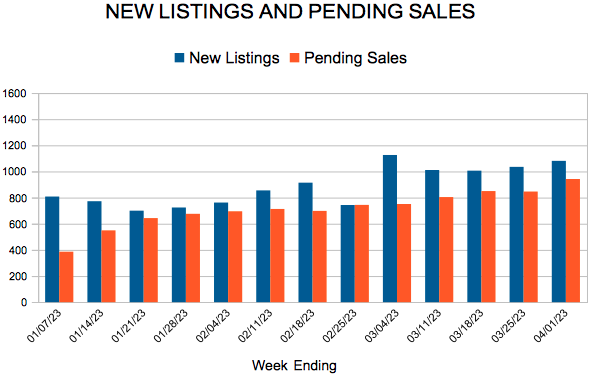
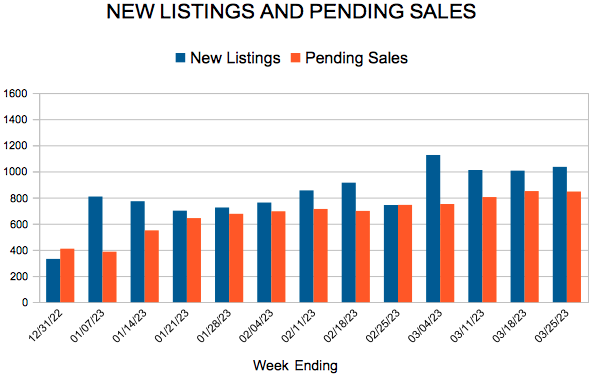
In March, sellers brought 4,980 new listings online which amounted to 23.9 percent fewer than last year. Of those and other active listings that sold, half lasted fewer than 27 days on market. That may seem high compared to last year’s figure of 12 days on market, but it’s in line with 2018, 2019 and 2020 for this time of year. This is another sign that normalizing demand has had a stabilizing effect on the market.
“While we do still see some competition for the most desirable listings, buyers don’t feel quite as rushed as they did a year or so ago, and they are being more selective,” said Jerry Moscowitz, President of Minneapolis Area REALTORS®. “The challenge now is on the monthly payment side which has forced buyers to think more critically about their options and budget.” Buyer activity continued to decline in the wake of the Federal Reserve’s rate hiking campaign, which has increased the cost of borrowing notably. Last month, buyers signed 3,767 purchase agreements, 27.9 fewer than a year ago. It was a similar story for closings—the 3,156 closed deals in March were down 20.5 percent. Largely because of rising rates, home sales have now seen 10 consecutive months of double-digit year-over-year declines that started in June 2022.
This means that sellers have had to adjust their expectations. There’s at least two sides to every story, and what’s seen as a return to normal for some could also be viewed as a downturn from a seller’s perspective. Sellers accepted an average of 98.6 percent of their list price compared to 102.7 percent last year. Price negotiations have moved slightly in buyers’ favor. But overall, the balance of the market has remained relatively tight because both buyer and seller activity have downshifted in tandem.
Inventory & Home Prices
The increases in home prices have dissipated as buyer activity has come down from record highs. Bidding wars have eased but not disappeared. “Even as sales have slowed from record highs, motivated buyers are out there but not to the same degree as recently,” said Brianne Lawrence, President of the Saint Paul Area Association of REALTORS®. “That means prices aren’t being pushed up like they were. This is welcomed news for buyers, but sellers are still getting solid offers in a reasonable timeframe.”
The Twin Cities metro is still technically in a seller’s market, just not to the same degree as last year. There were 5,769 homes available for sale at the end of March, or 2.1 percent more than last year. Since buyer demand has waned and our inventory rose slightly, March’s month’s supply of inventory was up 27.3 percent. That meant we had 1.4 months’ supply of inventory at the end of the month. Typically 4-6 months of supply are needed to reach a balanced, neutral market.
Location & Property Type
Market activity varies by area, price point and property type. New home sales fell 6.7 percent while existing home sales were down 21.1 percent. Single family sales fell 22.0 percent, condo sales declined 28.9 percent and townhome sales were down 3.9 percent. Sales in Minneapolis decreased 26.0 percent while Saint Paul sales fell 21.9 percent. Cities like Watertown, Victoria, Mendota Heights, Blaine and Hudson saw the largest sales gains while Robbinsdale, Mound, Isanti and New Richmond all had notably lower demand than last year.
March 2022 Housing Takeaways (Compared To A Year Ago)
(March 15, 2022) – According to new data from Minneapolis Area REALTORS® and the Saint Paul Area Association of REALTORS®, the median sales price across the Twin Cities grew 0.6 percent to $342,000. Home price growth has flattened out in the face of higher mortgage rates and deteriorating affordability.
Inventory & Home Prices
Although home prices have flattened out, they were still up slightly year-over-year. It’s possible that home prices soften in the coming months if rates rise further or remain sticky. “People should understand that their home hasn’t necessarily lost value simply because the median price falls,” according to Jerry Moscowitz, President of Minneapolis Area REALTORS®. “The median reflects the mid-point where half the homes sell for more and half for less. If there are more luxury properties, new homes or condos selling, that all impacts prices. So does supply and demand.”
Home buyers have been able to purchase bigger, nicer homes when rates were low because the payment allowed them to. That’s changed. Buyers are more willing to look at other property types, smaller homes and in different areas. That doesn’t mean every home out there is worth any less, but likely means those that do sell may have to be flexible and make some concessions.
Given the pullback in sales, we had 7.1 percent more homes on the market at month-end. Before buyers celebrate more options, the metro only has 1.3 month’s supply of inventory. Typically 4-6 months of supply are needed to reach a balanced market. Since both sales and listings have come down in tandem, the market remains fairly thin. That said, sellers don’t quite have the leverage they’ve enjoyed of late.
Sales & Listings
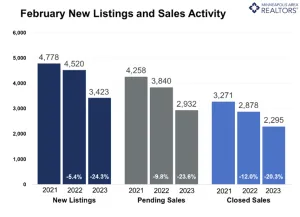
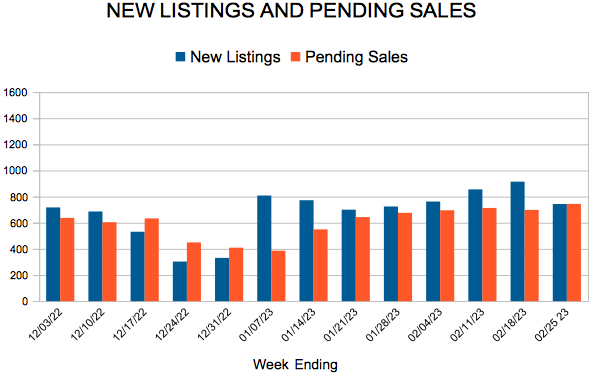
The Federal Reserve’s rate hikes have taken a toll on home sales. As some buyers were sidelined by higher mortgage rates and increased monthly payments, resulting in 2,932 purchase agreements, 23.6 percent below last year. The decline in pending sales is the second smallest since July 2022—behind January of this year and hinting that perhaps the declines are easing. “We’re in a place where buyers have more leverage but lowball offers likely won’t be successful,” said Brianne Lawrence, President of the Saint Paul Area Association of REALTORS®. “That means buyers are writing offers at or slightly below list price and they can take more time to decide on what works best for them.”
Sellers brought 3,423 homes on the market in February, 24.3 percent fewer listings than last year. Half of all sellers sold their listings for over 98.2 percent of list price compared to 100.0 percent last year. And they accepted those offers after an average of 62 days on market compared to 44 last year.
Location & Property Type
Market activity varies by area, price point and property type. New home sales fell 9.2 percent while existing home sales were down 25.7 percent. Single family sales fell 26.2 percent, condo sales declined 36.0 percent and townhome sales were down 6.4 percent. Sales in Minneapolis decreased 35.0 percent while Saint Paul sales fell 33.7 percent. Cities like Corcoran, Buffalo, Watertown and St. Francis saw the largest sales gains while Hudson, Forest Lake and Carver all had notably lower demand than last year.
February 2022 Housing Takeaways (compared to a year ago)

Licensed In Minnesota
All information deemed reliable but not guaranteed and should be independently verified.