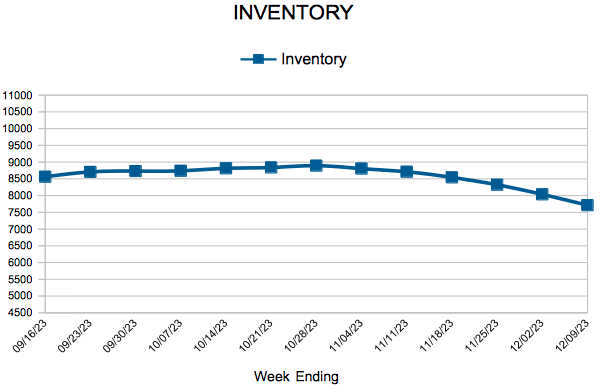
Inventory

 For Week Ending December 9, 2023
Nationally, the number of homes actively for sale remained mostly stable in November, climbing 0.7% year-over-year and 2.4% from the previous month, according to Realtor.com’s November 2023 Monthly Housing Market Trends Report. In addition, the number of newly listed homes for sale rose 7.5% year-over-year, snapping a 17-month streak in which listing activity declined, with an annual increase of 3% reported in the nation’s 50 largest metropolitan areas.
IN THE TWIN CITIES REGION, FOR THE WEEK ENDING DECEMBER 9:
FOR THE MONTH OF NOVEMBER:
All comparisons are to 2022
Click here for the full Weekly Market Activity Report. From MAAR Market Data News.
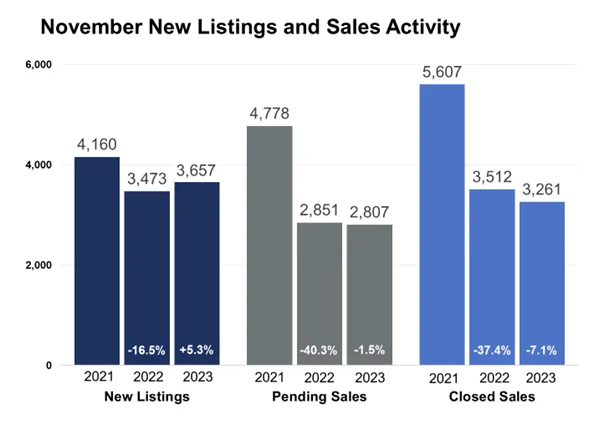
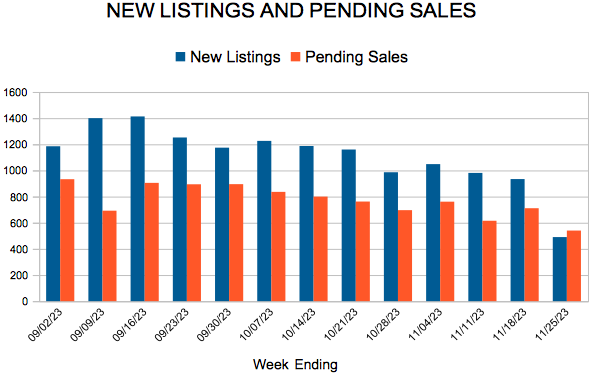
(Dec. 15, 2023) – According to new data from Minneapolis Area REALTORS® and the Saint Paul Area Association of REALTORS®, metro-wide home prices rose slightly in November. Sales activity was flat as mortgage rates softened slightly and new listings were up 5.3%.
Sellers, Buyers and Housing Supply
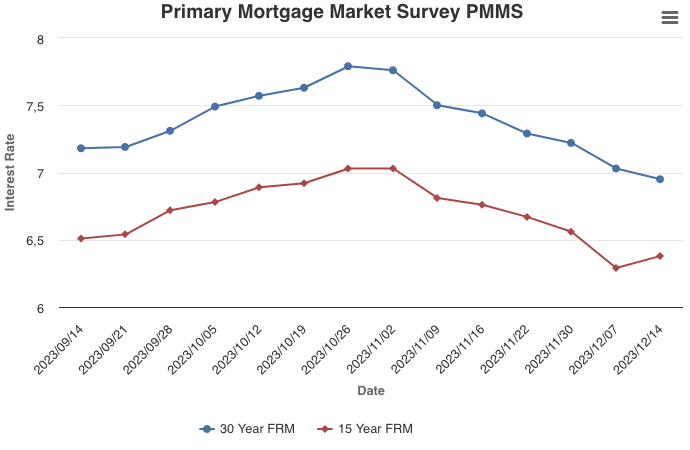
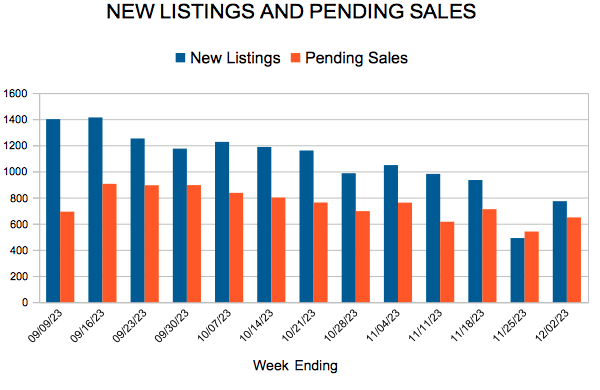
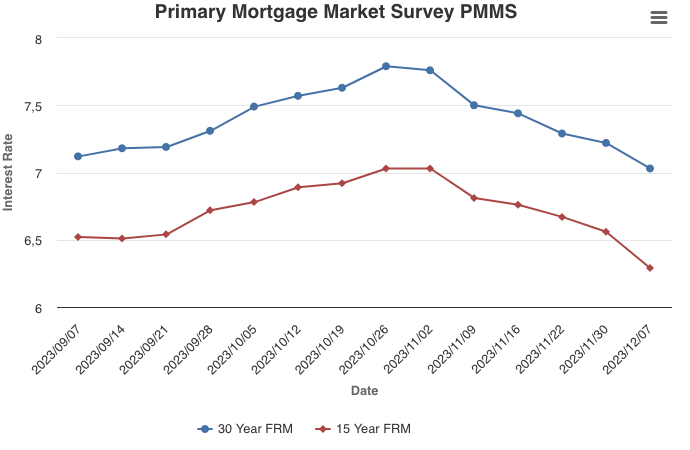
Rates have eased from over 8.0% in mid-October to around 7.0% by the end of November. While still elevated relative to the last 20 years, that figure is below its 50-year average. In addition to a low baseline comparison, that decline has helped the number of signed purchase agreements stabilize in November. And because sellers weren’t feeling quite as stuck in their homes, the dip in rates helped boost seller activity as some felt more confident about listing their homes.
Slightly lower rates could mean more buyers will qualify and write offers, and that fewer sellers will feel “locked in” to their mortgage rates. While that could mean more listing activity, it’s likely to be met with demand that’s been pent up for a while in the current affordability environment. Come spring market of 2024, that balance between supply and demand may offer key insights into how the year could play out.
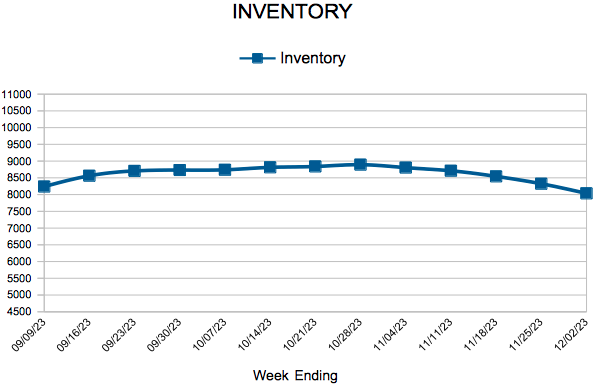
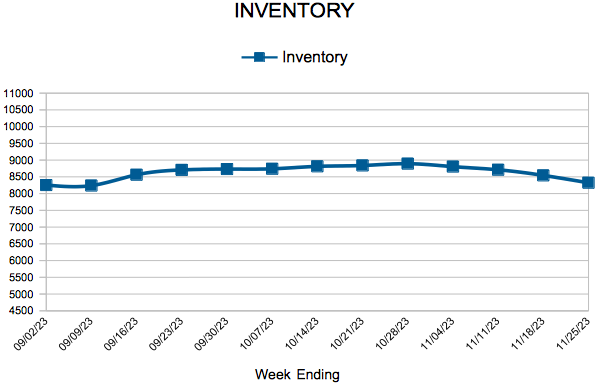
Buyers are still feeling the triple punch of low inventory, rising prices and still relatively high mortgage rates. Comparing pending sales to closed sales can offer unique insights into demand trends. Pending sales were down just 1.5% from last November and are a better leading indicator than closings. Closed sales—reflecting contracts mostly signed in September and October when rates were higher—were down 7.1%. On the supply side, inventory levels across the Twin Cities fell 5.1% compared to last November. While buyers are still finding limited options in their searches, deals are still occurring with some persistence and flexibility. In addition, the lack of existing inventory has benefited the new home market.
More buyers are choosing to deploy cash instead of paying today’s interest rates. Cash sales so far this year are at their highest level since 2014. Overall, since both supply and demand levels are lower, the relative balance hasn’t changed as much as expected. “The recent dip in rates has definitely spurred some buyer interest,” said Jerry Moscowitz, President of Minneapolis Area REALTORS®. “Buyers choosing to wait until spring should expect heightened competition.”
Prices, Market Times and Negotiations
Though seemingly counter-intuitive, home prices continued their ascent, up a modest 2.0% from last November. Prices are rising for several reasons.
Negotiations held firm but have balanced out recently. Sellers accepted 97.4% of their asking price, which was up from 2022 but down from 2021. Half the homes went under contract in under 23 days compared to 25 days last year. That figure was once again improved from 2022 but softer compared to 2021.
Those two indicators reflect the relatively strong position in which sellers still find themselves, assuming they’re willing to sell. For November, the median home price rose 2.0% to $362,000. The year as a whole will likely show 1.0 to 2.0% price growth. “Buyers seem more sensitive to changes in rates than to the rate itself,” said Brianne Lawrence, President of the Saint Paul Area Association of REALTORS®. “While even a full point decrease in the rate hasn’t magically solved our affordability issues, it does lower monthly payments slightly.”
Affordability, Rates and Payments
Even as the Federal Reserve paused their rate hikes, the impact of mortgage rates on monthly payments is significant. Mortgage rates hit a 23-year high in October but retreated nearly a full point since. The Housing Affordability Index reached its lowest level since at least 2004. Given rates, incomes and prices at the time, affordability was better in 2006 than it is today. Using some assumptions around taxes and insurance, the local monthly payment on the median priced home stands at $2,650 so far this year compared to $1,600 in 2020.
Location & Property Type
Market activity always varies by area, price point and property type. New home sales rose while existing home sales fell. Condo sales rose more than single family and townhome units. Purchase agreements were down 13.0% in St. Paul but up 14.5% in Minneapolis. Cities farther out such as Cologne, Princeton, New Prague and North Oaks saw among the largest sales gains while Monticello, Isanti and Shorewood all had weaker demand.
November 2023 Housing Takeaways (compared to a year ago)
December 14, 2023
Potential homebuyers received welcome news this week as mortgage rates dropped below seven percent for the first time since August. Given inflation continues to decelerate and the Federal Reserve Board’s current expectations that they will lower the federal funds target rate next year, there will likely be a gradual thawing of the housing market in the new year.
Information provided by Freddie Mac.
 For Week Ending December 2, 2023
Mortgage rates dropped for the fifth consecutive week, with the average 30-year fixed-rate mortgage declining to 7.22% the week ending November 30, 2023, the lowest level since September, according to Freddie Mac. As a result, mortgage applications increased 2.8% on a seasonally adjusted basis from the previous week, and were up 43% on an unadjusted basis, according to data from the Mortgage Bankers Association. Refinance activity also improved, rising 14% from the previous week, marking the strongest week in two months.
IN THE TWIN CITIES REGION, FOR THE WEEK ENDING DECEMBER 2:
FOR THE MONTH OF OCTOBER:
All comparisons are to 2022
Click here for the full Weekly Market Activity Report. From MAAR Market Data News.
December 7, 2023
The 30-year fixed-rate mortgage averaged near 7 percent this week, down from nearly 7.80 percent just six weeks ago. When rates began to rapidly drop, purchase applications rebounded initially, but this improvement in demand diminished in the last week. Although these lower rates remain a welcome relief, it is clear they will have to further drop to more consistently reinvigorate demand.
Information provided by Freddie Mac.

Licensed In Minnesota
All information deemed reliable but not guaranteed and should be independently verified.