
Strong buyer activity has continued into the fall, which is normally the start of the seasonal slowing of the housing market.
Another record-setting month, though sales rising faster than listings
New listings and sales up, price growth strong, but supply levels wearing thin
(October 19, 2020) – According to new data from the Minneapolis Area REALTORS® and the Saint Paul Area Association of REALTORS®, buyer and seller activity in the 16-county Twin Cities metro both increased from 2019.
This summer and even early fall market continue to resemble more of a spring market. Although some activity from the 2nd quarter was shifted into the 3rd quarter, buyers more than made up for the lost time and continued to ink new records. Sales activity year-to-date is already above last year. Seller activity—while still lagging—made its largest gain since March.
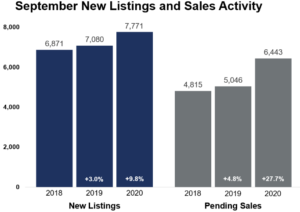
Specifically, pending sales rose 27.7 percent compared to last September to 6,443, marking at least an 18-year record high for the month going back to 2003. At 7,771, new listings were up 9.8 percent, which was the highest September since 2008.
“The demand out there in the market at this time of year is truly remarkable—especially during a pandemic,” according to Linda Rogers, President of Minneapolis Area REALTORS®. “Even though seller activity is on the rise, inventory levels remain extremely low, particularly in the affordable ranges. Serious buyers should be prepared to write strong offers quickly.”
While nothing about 2020 could be called predictable, one predictable outcome of historically strong housing demand and tight supply is rising prices. The metro-wide median sales price rose 10.8 percent to $310,000, the largest year-over-year gain since February 2018. The median sales price for new homes, however, rose 2.7 percent to $417,000 while existing home prices rose 11.1 percent to $300,000.
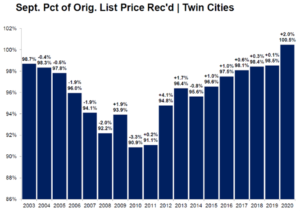
Multiple offer situations remain common as a large pool of buyers compete over a thinning stock of properties. Sellers, on average, accepted offers of 100.5 percent of their original list price—marking a new high for any month going back to at least 2003. A balanced market typically has 5-6 months of supply. At 1.7 months, sellers are still in the driver’s seat in most areas.
With such an imbalance in market forces, properties sold 31.8 percent faster than last year. Half the sales occurred in less than 15 days, tying with August for a 14-year record pace. “Even though activity is strong overall,” said Patrick Ruble, President of the Saint Paul Area Association of REALTORS®. “Every city, neighborhood, price range and property type are unique.”
For example, sales rose 41.4 percent in Minneapolis and 33.8 percent in St. Paul while new listings were up 47.8 and 17.7 percent, respectively. Seller activity in Minneapolis reached its highest level since 2007, while seller activity in the metro overall reached its highest level since 2008. The region’s condo market, however, saw new listings rise 28.9 percent while sales fell 2.6 percent. The metro condo market has 4.0 months of supply while that figure is 6.0 months in Minneapolis. Perhaps driven by attractive jumbo rates, sales of homes priced over $1M are up over 60.0 percent from last September.
September 2020 by the numbers compared to a year ago
- Sellers listed 7,771 properties on the market, a 9.8 percent increase from last September
- Buyers signed 6,443 purchase agreements, up 27.7 percent (6,583 closed sales, up 21.1 percent)
- Inventory levels fell 32.0 percent to 8,936 units
- Months Supply of Inventory was down 37.0 percent to7 months (5-6 months is balanced)
- The Median Sales Price rose 10.8 percent to $310,000
- Cumulative Days on Market decreased 15.9 percent to 37 days, on average (median of 15, down 31.8 percent)
- Changes in Sales activity varied by market segment
- Single family sales were up 34.0 percent; condo sales fell 2.6 percent; townhome sales increased 16.5 percent
- Traditional sales rose 29.6 percent; foreclosure sales were down 47.1 percent; short sales were flat
- Previously owned sales were up 26.7 percent; new construction sales climbed 53.1 percent
Weekly Market Report

For Week Ending October 10, 2020
According to a National Association of Home Builders analysis of Census Bureau data, the lot size of new construction homes is getting smaller. The median lot size for single-family homes sold in 2019 was 8,177 square feet, or .188 acres, its smallest on record. While lot sizes vary by region due to population density, the availability of land, and local regulations, shrinking lot sizes is one way to help partially offset the increasing costs of building a new home.
In the Twin Cities region, for the week ending October 10:
- New Listings increased 12.4% to 1,705
- Pending Sales increased 25.2% to 1,375
- Inventory decreased 30.2% to 9,091
For the month of September:
- Median Sales Price increased 10.8% to $310,000
- Days on Market decreased 15.9% to 37
- Percent of Original List Price Received increased 2.0% to 100.5%
- Months Supply of Homes For Sale decreased 33.3% to 1.8
All comparisons are to 2019
Click here for the full Weekly Market Activity Report. From MAAR Market Data News.
Weekly Market Report
For Week Ending October 3, 2020
As the weather continues to cool, real estate activity slowly cools along with it. While buyer activity is following its normal seasonal trend lower, it remains substantially higher than the same time last year, continuing a months-long trend. Strong buyer demand continues to draw down the available inventory of homes for sale at a rapid pace, leaving buyers with fewer homes to choose from and many sellers with multiple offers.
In the Twin Cities region, for the week ending October 3:
- New Listings increased 10.4% to 1,702
- Pending Sales increased 19.1% to 1,493
- Inventory decreased 29.7% to 9,234
For the month of August:
- Median Sales Price increased 9.8% to $315,000
- Days on Market decreased 4.9% to 39
- Percent of Original List Price Received increased 1.3% to 100.3%
- Months Supply of Homes For Sale decreased 30.8% to 1.8
All comparisons are to 2019
Click here for the full Weekly Market Activity Report. From MAAR Market Data News.
Weekly Market Report
For Week Ending September 26, 2020
The Mortgage Bankers Association reported that the share of mortgages currently in forbearance dropped to 6.93% as of September 13, 2020, the 15th weekly decline in a row and its lowest level in five months. The share of mortgages in forbearance peaked in June at 8.55%. The continued decline is a positive sign, but current levels suggest many homeowners are still struggling from unemployment or underemployment due to the pandemic.
In the Twin Cities region, for the week ending September 26:
- New Listings increased 11.2% to 1,747
- Pending Sales increased 27.7% to 1,449
- Inventory decreased 31.1% to 9,154
For the month of August:
- Median Sales Price increased 9.8% to $315,000
- Days on Market decreased 4.9% to 39
- Percent of Original List Price Received increased 1.3% to 100.3%
- Months Supply of Homes For Sale decreased 30.8% to 1.8
All comparisons are to 2019
Click here for the full Weekly Market Activity Report. From MAAR Market Data News.
August Monthly Skinny Video
In August, showings and pending sales remained at strong levels while housing inventory remained limited, continuing the competitive bidding market we have seen in recent months.
Weekly Market Report
For Week Ending September 19, 2020
In the latest National Association of Home Builders / Wells Fargo Housing Market Index report released this week, home builder confidence in the market for newly-built single-family homes rose five points from 78 in August to 83 in September, tying an all-time high in the 35-year history of the index. While lumber prices are up 170% from mid-April, adding more than $16,000 to the price of a typical new single-family home, strong demand by homebuyers has buoyed builders’ outlook.
In the Twin Cities region, for the week ending September 19:
- New Listings increased 8.6% to 1,854
- Pending Sales increased 25.8% to 1,527
- Inventory decreased 31.2% to 9,076
For the month of August:
- Median Sales Price increased 9.8% to $315,000
- Days on Market decreased 4.9% to 39
- Percent of Original List Price Received increased 1.3% to 100.3%
- Months Supply of Homes For Sale decreased 30.8% to 1.8
All comparisons are to 2019
Click here for the full Weekly Market Activity Report. From MAAR Market Data News.
Another record-setting month despite shortage of listings
New listings and sales up, price growth strong, but some activity from Q2 was postponed into July/August
(September 18, 2020) – According to new data from the Minneapolis Area REALTORS® and the Saint Paul Area Association of REALTORS®, buyer and seller activity in the 16-county Twin Cities metro both increased from 2019.
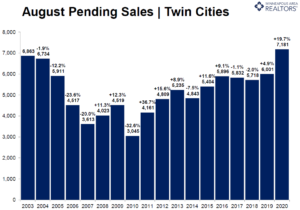
After a 12.0 percent gain in July, the number of signed purchase agreements rose 19.7 percent in August, compared to last year. At 7,181 pending sales, August 2020 had the highest recorded pending sales count for the month, and also the highest for any month of any year going back to June 2004. Although some of the pent-up demand from June and July was shifted into August, recent gains have turned year-to-date pending sales positive—now up 4.3 percent compared to 2019.
“Buyers were truly out in force last month,” according to Linda Rogers, President of Minneapolis Area REALTORS®. “The gains were widespread, with both urban and suburban locations appealing to home buyers.”
Relentless demand and diminished supply have accelerated home price growth. The median sales price in the metro rose 9.8 percent to $315,000. Excluding July of this year, that’s the strongest rate of price growth since March 2018. The median price of a newly built home was around $405,000. Historically low mortgage rates below 3.0 percent can partly offset affordability challenges caused by rising prices.
Despite a modest gain in new listings from last August, buyer demand continued to overwhelm sellers. Multiple offer situations are commonplace, and many sellers are accepting offers above list price. In fact, sellers received, on average, 100.3 percent of their original asking price—matching the 18-year record high from June 2018. A balanced market typically has 5-6 months of supply. At just 1.7 months, sellers are still in the driver’s seat.
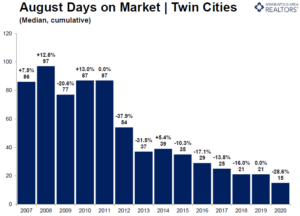
As sales hit a new high, market times reached a new low. Half of the sales occurred in less than 15 days. “People are searching high and low for properties that meet their needs,” said Patrick Ruble, president of the Saint Paul Area Association of REALTORS®. “Attractive rates and a lack of supply means homes won’t last long on the market.”
While an expectation of prolonged tele-commuting has encouraged some to seek more space farther out, it’s notable that Minneapolis and St. Paul saw sales increase 28.1 and 29.2 percent respectively. New listings were also up notably in both cities. Condo sales rose 1.4 percent across the metro but were up 5.6 percent in Minneapolis and down 17.3 percent in St. Paul. The luxury segment has performed quite well recently. Metro-wide sales over $1M surged 51.1 percent from last August.
AUGUST 2020 BY THE NUMBERS COMPARED TO A YEAR AGO
- Sellers listed 7,823 properties on the market, a 1.3 percent increase from last August
- Buyers signed 7,181 purchase agreements, up 19.7 percent (6,765 closed sales, up 0.6 percent)
- Inventory levels fell 32.4 percent to 8,756 units
- Months Supply of Inventory was down 34.6 percent to7 months (5-6 months is balanced)
- The Median Sales Price rose 9.8 percent to $315,000
- Cumulative Days on Market decreased 4.9 percent to 39 days, on average (median of 15, down 28.6 percent)
- Changes in Sales activity varied by market segment
- Single-family sales were up 23.2 percent; condo sales rose 1.4 percent; townhome sales increased 14.8 percent
- Traditional sales rose 20.4 percent; foreclosure sales were up 23.7 percent; short sales fell 28.6 percent
- Previously owned sales were up 18.8 percent; new construction sales climbed 46.4 percent
Weekly Market Report
For Week Ending September 12, 2020
The Mortgage Bankers Association (MBA) Mortgage Credit Availability Index (MCAI) in August fell by 4.7 percent to 120.9. A decline in the MCAI indicates that lending standards are tightening, and this latest drop finds the index at its lowest point since March 2014. Tightening lending standards often includes a reduction in loan programs with low credit scores, high loan-to-value ratios, and reduced borrower documentation requirements. So while mortgage rates continue to remain near all-time lows, qualifying for a mortgage is becoming a little more difficult for some borrowers.
In the Twin Cities region, for the week ending September 12:
- New Listings decreased 3.8% to 1,783
- Pending Sales increased 13.5% to 1,384
- Inventory decreased 31.5% to 8,928
For the month of August:
- Median Sales Price increased 9.8% to $315,000
- Days on Market decreased 4.9% to 39
- Percent of Original List Price Received increased 1.3% to 100.3%
- Months Supply of Homes For Sale decreased 30.8% to 1.8
All comparisons are to 2019
Click here for the full Weekly Market Activity Report. From MAAR Market Data News.
Weekly Market Report
For Week Ending September 5, 2020
Strong buyer activity continues into the back-to-school season that normally signals the seasonal slowing of the housing market. With more buyers in the market and the continued constrained supply of homes for sale, speedy sales and multiple offers are likely to remain a common occurrence and will keep agents and prospective homebuyers and sellers quite busy this fall.
In the Twin Cities region, for the week ending September 5:
- New Listings decreased 3.4% to 1,669
- Pending Sales increased 40.3% to 1,601
- Inventory decreased 30.2% to 8,942
For the month of July:
- Median Sales Price increased 10.6% to $313,000
- Days on Market increased 7.9% to 41
- Percent of Original List Price Received increased 0.5% to 100.1%
- Months Supply of Homes For Sale decreased 23.1% to 2.0
All comparisons are to 2019
Click here for the full Weekly Market Activity Report. From MAAR Market Data News.
- « Previous Page
- 1
- …
- 74
- 75
- 76
- 77
- 78
- …
- 85
- Next Page »
