 For Week Ending May 15, 2021
Despite elevated demand for housing, construction of new homes fell in April, with the U.S. Department of Housing and Urban Development and the U.S. Census Bureau reporting a 9.5% decrease in housing starts from the previous month. Rising building costs continue to hinder affordability and inventory for many homebuyers, although shortages in labor, issues with the U.S. supply chain, and lasting impact from late winter storms have also contributed to the decline in new construction activity, putting some projects on pause for the time being.
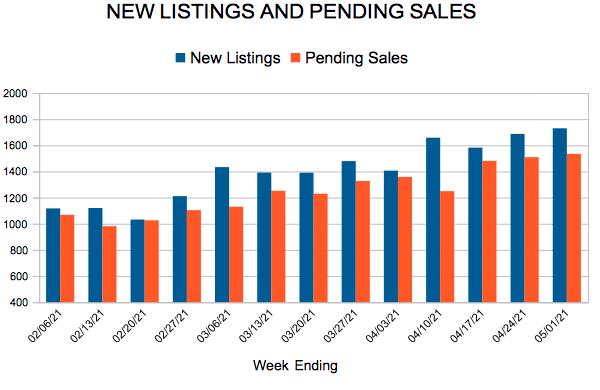
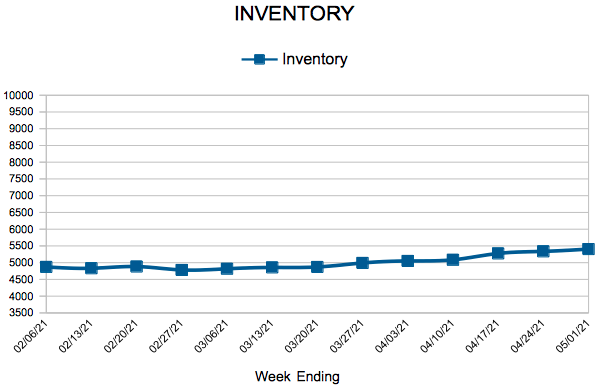
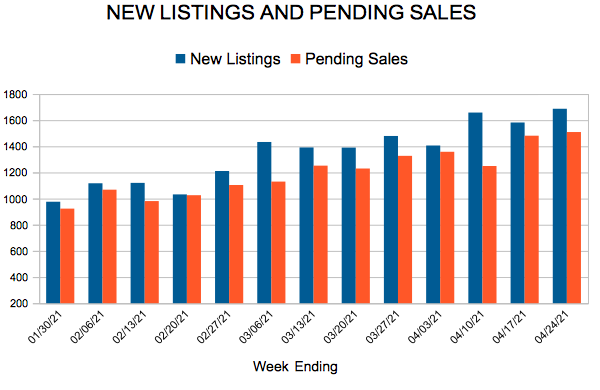
In the Twin Cities region, for the week ending May 15:
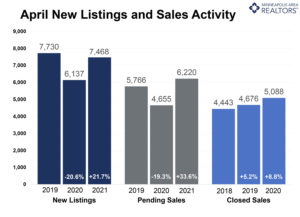
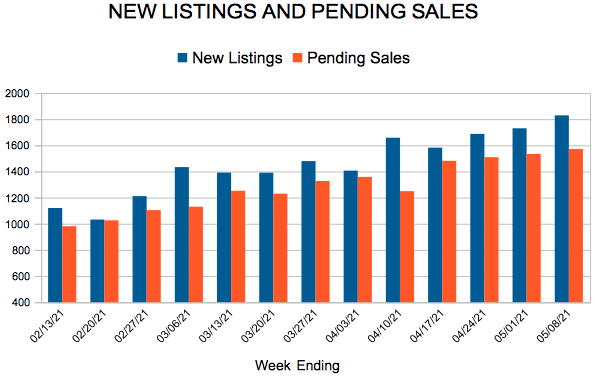
- New Listings increased 13.8% to 1,926
- Pending Sales increased 13.5% to 1,573
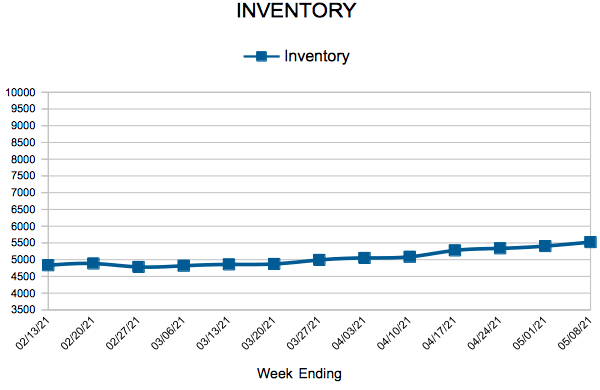
- Inventory decreased 45.8% to 5,765
For the month of April:
- Median Sales Price increased 10.2% to $336,250
- Days on Market decreased 34.0% to 31
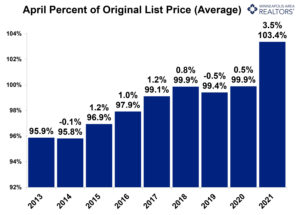
- Percent of Original List Price Received increased 3.4% to 103.3%
- Months Supply of Homes For Sale decreased 52.4% to 1.0
All comparisons are to 2020
Click here for the full Weekly Market Activity Report. From MAAR Market Data News.