Existing Home Sales

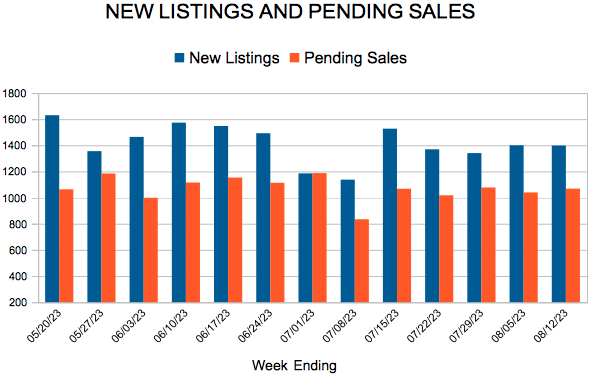
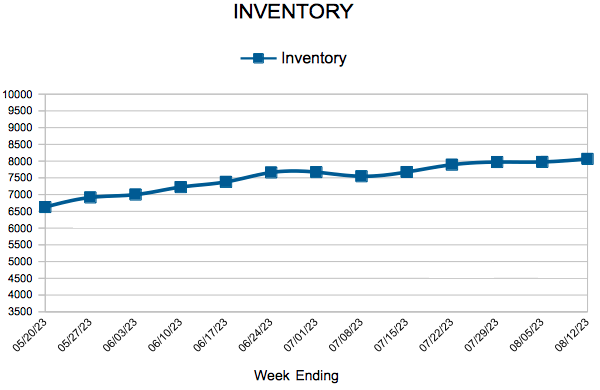
 For Week Ending August 12, 2023
Seller profit margins are up nationwide following three quarterly declines, according to ATTOM’s Q2 2023 U.S. Home Sales Report. Typical profit margins on medianpriced single-family and condo sales climbed to 47.7% in the second quarter of 2023, up from 43.9% the previous quarter, representing the first increase in a year. The rise in profit margins was boosted by recent growth in median single-family home and condo prices, which increased in more than 90% of the country in Q2, according to the report.
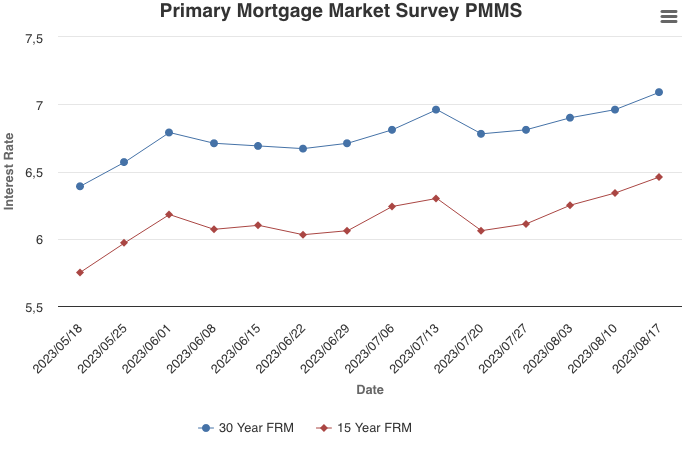
IN THE TWIN CITIES REGION, FOR THE WEEK ENDING AUGUST 12:
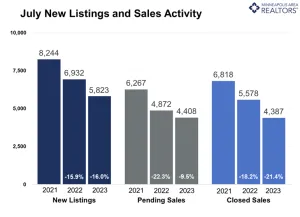
FOR THE MONTH OF JULY:
All comparisons are to 2022
Click here for the full Weekly Market Activity Report. From MAAR Market Data News.
August 17, 2023
The economy continues to do better than expected and the 10-year Treasury yield has moved up, causing mortgage rates to climb. The last time the 30-year fixed-rate mortgage exceeded seven percent was last November. Demand has been impacted by affordability headwinds, but low inventory remains the root cause of stalling home sales.
Information provided by Freddie Mac.
(August 15, 2023) – According to new data from Minneapolis Area Realtors® and the Saint Paul Area Association of REALTORS®, home prices were flat in July. Both buyer and seller activity were lower compared to July 2022.
Sales & Prices
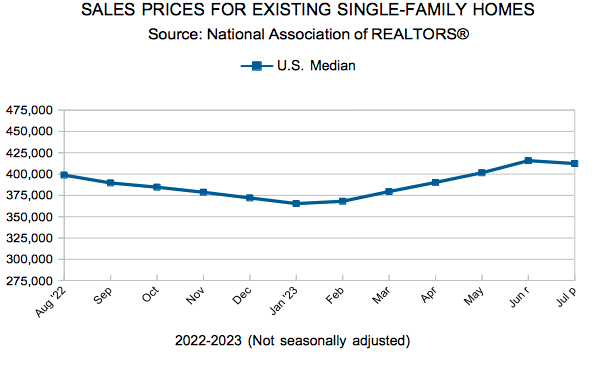
Home prices were down slightly in April and May, up slightly in June, and flat in July. April marked the first year-over-year price decline since February 2012. The typical home price is now up 7.1 percent from 2021, up 20.0 percent from 2020 and up 32.3 percent from 2019. But market dynamics always vary by price point, property type and location. Signed purchase agreements fell 9.5 percent from last July when buyer activity had already declined in the face of higher rates. Closings were down 21.4 percent but are a lagging indicator. As a more forward-looking indicator, pending sales are a more timely measure.
Of the sellers that did list and sell their properties, they received an average of 100.8 percent of list price after 29 days on market. This reflects a persistently tight supply picture. Homes are still selling faster than in July of 2018, 2019 and 2020. “It still surprises me how often I hear and read about a crash,” said Brianne Lawrence, President of the Saint Paul Area Association of REALTORS®. “Prices flattening out and homes spending longer on market combined with a possible downtick in rates could be just the medicine the doctor ordered for frustrated buyers.”
Listings and Inventory
July sellers listed 16.0 percent fewer homes on the MLS than last year. Inventory levels slid a similar 16.1 percent. Would-be sellers are faced with a unique decision: stay put in a home that no longer meets their needs or take their equity and embrace higher prices and rates until refinancing. Sellers are feeling the “golden handcuffs” and are reluctant to swap a 3.0 percent rate for 7.0 percent. “When is the best time to buy a home? When you’re ready,” said Jerry Moscowitz, President of Minneapolis Area Realtors®. “Focus on what you can’t change such as layout and location. Rooms can be repainted. Counters and appliances can be updated. Loans can be refinanced.”
Both supply and demand have come down in unison, meaning the balance between buyers and sellers remains tight. Inventory levels fell 16.1 percent in July to 7,842 active listings. The market still favors sellers, but not to the same degree as the last few years. The market has 2.1 months supply of inventory but typically 4-6 months of supply are needed to achieve a balanced market.
Location & Property Type
Market activity varies by area, price point and property type. New home sales rose 61.8 percent while existing home sales were down 13.5 percent. Single family sales fell 11.6 percent, condo sales were flat and townhome sales were down 4.5 percent. Sales in Minneapolis decreased 12.7 percent while Saint Paul sales fell 13.8 percent. Cities such as Mounds View, St. Anthony, Zumbrota and Vadnais Heights saw the largest sales gains while Hudson, Cambridge, New Richmond and Monticello all had notably lower demand than last year.
July 2023 Housing Takeaways (compared to a year ago)
 For Week Ending August 5, 2023
According to ATTOM’s Q2 2023 Home Affordability Report, 98% of median-priced U.S. single-family homes and condos were less affordable than their historical averages in the second quarter of 2023, up from 94% in the first quarter, with the decline in affordability attributed in part to rising sales prices, which have continued to outpace wage growth. Nationally, median single-family home values rose 10% from the first quarter to the second quarter, with residents needing 33% of their income to cover major homeownership expenses, the highest level since 2007.
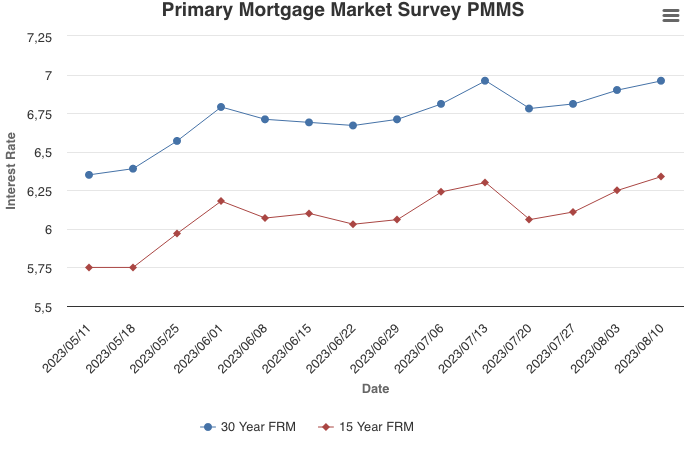
IN THE TWIN CITIES REGION, FOR THE WEEK ENDING AUGUST 5:
FOR THE MONTH OF JUNE:
All comparisons are to 2022
Click here for the full Weekly Market Activity Report. From MAAR Market Data News.
August 10, 2023
For the third straight week, mortgage rates continued creeping up and are now just shy of seven percent. There is no doubt continued high rates will prolong affordability challenges longer than expected, particularly with home prices on the rise again. However, upward pressure on rates is the product of a resilient economy with low unemployment and strong wage growth, which historically has kept purchase demand solid.
Information provided by Freddie Mac.

Licensed In Minnesota
All information deemed reliable but not guaranteed and should be independently verified.