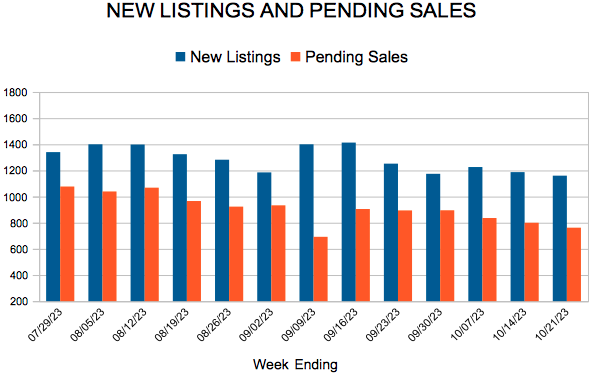
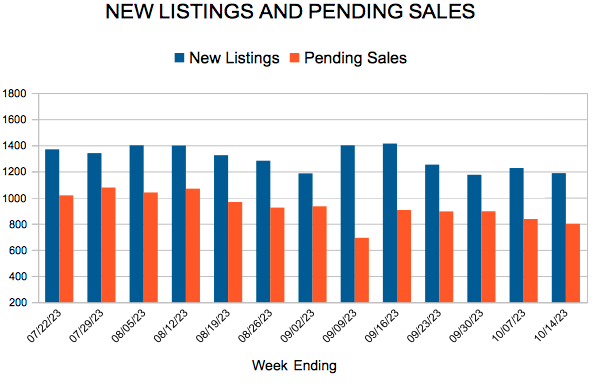
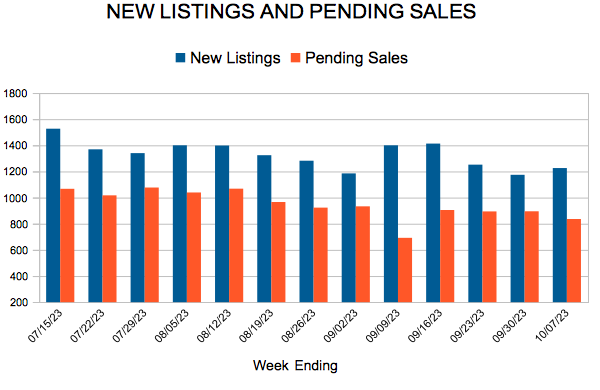
New Listings and Pending Sales
(October 16, 2023) – According to new data from Minneapolis Area REALTORS® and the Saint Paul Area Association of REALTORS®, home prices rose slightly in September. Both buyer and seller activity were lower compared to last year but there were important differences across areas and market segments.
Sellers, Buyers and Housing Supply
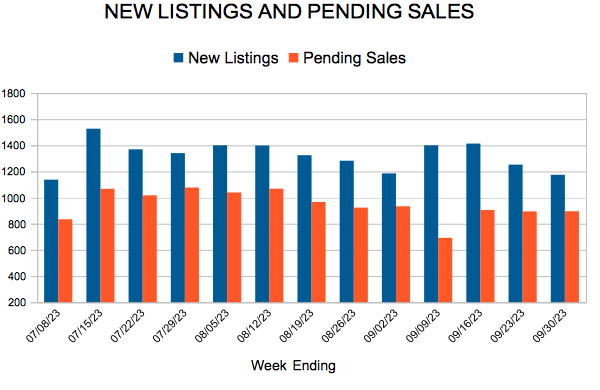
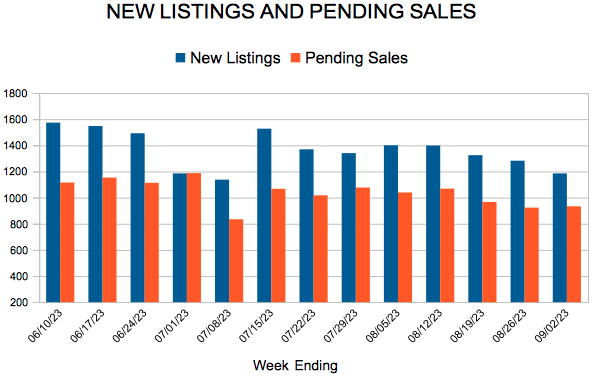
Many homeowners are feeling incentivized to stay put—particularly those with sub-4.0% rates who would face much higher payments given the increase in prices and stubbornly high mortgage rates. As a result, new listings were down another 6.4% after a 17.2% decline last September. Buyers face a similar set of considerations, but first-timers don’t have the benefit of equity from previous home ownership, and many struggle to amass a downpayment given the rising cost of living. Closings were down 17.1% but pending sales were down a more modest 7.3%—perhaps offering a glimpse of what’s to come. Millennials now in their prime homeownership years and Boomers looking to downsize are finding limited options. More buyers are choosing to deploy cash instead of paying near 8.0% interest, but that’s difficult for many.
The reason the market still feels so “tight” and why prices continue to rise is because both buyer and seller activity have downshifted in tandem. In the past, we’ve seen housing supply levels rise as demand falls, and that usually results in softening prices. But that’s not the case here. Both supply and demand levels are down, so the relative balance hasn’t changed as much as some anticipated. In addition, sellers don’t appear eager to list their homes any time soon. “Many homeowners not experiencing a major life or job change aren’t quite as motivated to make a move,” said Jerry Moscowitz, President of Minneapolis Area REALTORS®. “Many qualified buyers are finding success purchasing a home now and plan to refinance when the interest rates are lower.”
Prices, Market Times and Negotiations
The downshift on both sides of the closing table has also kept market times relatively brisk and negotiations are still leaning in the seller’s favor. Half the homes went under contract in under 17 days compared to 19 days last September. Last month sellers accepted 99.3% of their original list price compared to 98.9% last year. Those two indicators reflect the surprisingly strong position in which many sellers still find themselves.
Despite softer demand, sluggish seller activity has also kept prices elevated. There has been just one month of year-over-year price declines since February 2012. That was in May of this year. There have been some flat months this year as well as modest gains, but it appears prices could be up slightly for the year. For September, the median home price rose 2.2% to $370,305. “Sellers who locked in low interest rates are reluctant to give them up,” said Brianne Lawrence, President of the Saint Paul Area Association of REALTORS®. “That’s kept inventory low and prices strong, but it still feels quite different from the last few years.” We have 8,700 active listings. That needs to be closer to 20,000 to have a balanced market.
Affordability, Rates and Payments
Even as the Federal Reserve paused and left their target rate unchanged at the September meeting, the 30-year fixed mortgage rate reached its highest level since 2000. The Housing Affordability Index, as expected, hit its lowest level since at least 2004. Given rates, incomes and prices at the time, affordability was better in 2006 than it is today. Using some assumptions around taxes and insurance, the monthly payment on the median priced home stands at $2,650 so far this year compared to $1,600 in 2020.
Location & Property Type
Market activity varies by area, price point and property type. New home sales rose while existing home sales fell. Single family sales were down more than townhome sales. Closings were down around 17.0% in both Minneapolis and St. Paul. Cities such as St. Anthony, Orono, Richfield and Golden Valley saw among the largest sales gains while New Hope, Robbinsdale, Eagan and Andover all had notably lower demand than last year.
September 2023 Housing Takeaways (compared to a year ago)
(September 15, 2023) – According to new data from Minneapolis Area REALTORS® and the Saint Paul Area Association of REALTORS®, home prices rose modestly in August. Both buyer and seller activity were lower compared to last year.
Sales & Prices
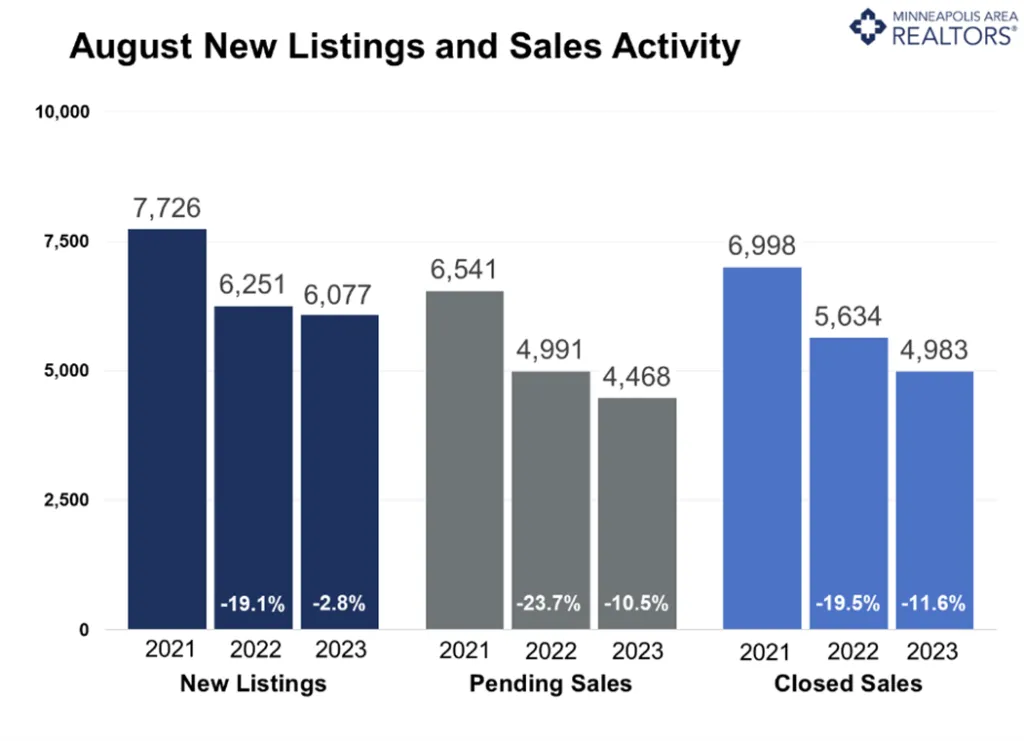
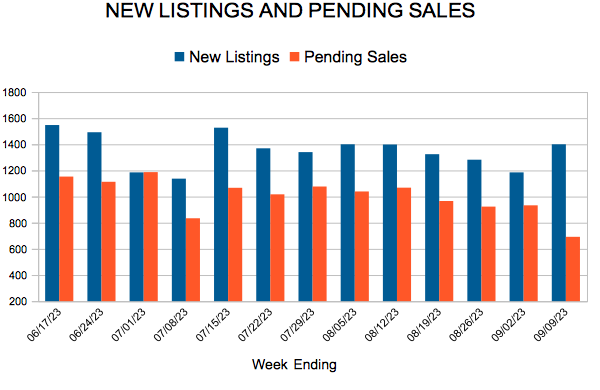
Pending home sales—or listings with accepted offers—were down 10.5 percent compared to last August. While those declines have moderated, it’s mostly due to comparing to a lower baseline last year as sales were slowing due to rising interest rates causing affordability challenges. Closed sales fell 11.6 percent overall, but townhomes had the smallest decline of any property type while new home sales rose an impressive 33.2 percent. Existing homeowners are choosing to stay put instead of trading up for a substantially higher monthly payment driven by rising prices and mortgage rates. That means builders listing new homes are benefiting from a shift in demand to new construction.
Home prices were down slightly in April and May, up slightly in June, and flat in July. The August median home price was up 2.7 percent from August 2022, up 20.0 percent from August 2021 and up 32.3 percent from August 2020. It’s not clear whether softening prices will continue, that depends on rates and demand. Of the homeowners who did sell their properties, they received an average of 100.0 percent of list price after 32 days on market. Market times were up 18.5 percent from last year, yet homes are still selling faster than in August of 2018 and 2019 and the same pace as 2020. “Not to oversimplify, but prices are rising because we still have a decent number of buyers competing for an insufficient number of homes,“ said Brianne Lawrence, President of the Saint Paul Area Association of REALTORS®. “Sellers of existing homes staying put forces some buyers to look at new homes or consider other more affordable property types such as townhomes, although affordability does vary within that segment.”
Listings and Inventory
In August, sellers listed only 2.8 percent fewer homes than last year, which is the smallest decline since May 2022 and a possible sign some existing supply could start to loosen up. Part of that is also due to a low baseline level. Inventory levels still slid 11.8 percent as of the most recent data. Sellers who locked in low interest rates are reluctant to give them up. “There’s always a certain level of activity in the market because of family changes, economic reasons or relocations to name a few,” said Jerry Moscowitz, President of Minneapolis Area REALTORS®. “But some less motivated buyers without that urgency are looking more cautiously at budgets and monthly payments.”
The balance between buyers and sellers has remained tight because both sales and listings have come down together. There were just over 8,000 active listings at the end of August; that needs to be closer to 20,000 to have a balanced market. At a still-low 2.2 months supply of inventory, buyers don’t have the upper hand some thought they would. Typically 4-6 months of supply are needed to reach a balanced market.
Location & Property Type
Market activity varies by area, price point and property type. New home sales rose 21.1 percent while existing home sales fell 13.9 percent. Single family sales were down 13.5 percent, condo sales decreased 9.0 percent and townhome sales were down just 3.2 percent. Sales in Minneapolis declined 17.0 percent while Saint Paul sales fell 11.5 percent. Cities such as Rogers, Otsego, Medina and Victoria saw the largest sales gains while Red Wing, East Bethel and Columbia Heights all had notably lower demand than last year.
For more information on weekly and monthly housing numbers visit www.mplsrealtor.com or www.spaar.com
August 2023 Housing Takeaways (compared to a year ago)

Licensed In Minnesota
All information deemed reliable but not guaranteed and should be independently verified.