(June 18, 2020) – According to new data from the Minneapolis Area REALTORS® and the Saint Paul Area Association of REALTORS®, market activity was down from last May but increased from this April.The number of residential showings has reached a new high for the year. The decline in pending sales was about half that of new listings, as buyers were motivated by record-low mortgage rates. Pending sales were down just 2.5 percent in the $350-500K price range but fell 34.8 percent on homes between $750K-1M. For new listings, the reverse was true with the biggest declines in the affordable price range of $150-190K and the smallest drop in new listings for homes over $1M.
“Activity is moving through the system—fewer April contracts now means fewer closed sales in May,” said Linda Rogers, President of Minneapolis Area REALTORS®. “But smaller declines in May contracts combined with strong showing activity are reasons for cautious optimism.”Home prices rose to about $295K compared to last May, but it was the smallest percentage gain since January 2017. April was the first month on record where the median home price surpassed $300K. Homes also sold more quickly this May than last, as motivated buyers remained committed, but less serious buyers and “lookers” were not as active. The share of their list price that sellers received declined to 99.6 percent from 100.0 percent last May.
“We expected May to be a slight improvement from April and so far that is mostly true,” said Patrick Ruble, President of the St. Paul Area Association of REALTORS®. “Not only is showing activity displaying some strength, but the home buyers and sellers we work with are starting to feel more confident as well. Rates are at historic lows and should remain low throughout the year.”
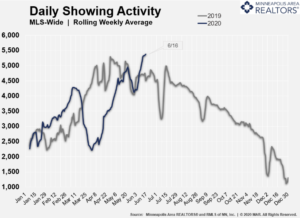
Showing activity rose by 11.0 percent from the most recent week compared to the week prior and has reached new highs. The economic toll impacted market segments differently. First-time buyers are more likely to be impacted by job losses in the leisure, hospitality or retail space, while those shopping in the luxury brackets may be impacted by turmoil in equity and energy markets. The middle-market ranges are outperforming, helped along by professionals who can work from home. Given the lack of supply—especially close to the core cities—and price points in the low $400s, the new home market is more stable than the existing resale market.
Mortgage rates on a 30-year fixed loan are around 3.25 percent—the lowest they have ever been. While recessions can pause market activity, they typically only have a minor impact on home prices. A persistently undersupplied market—particularly for affordable homes—may help prices stay afloat.
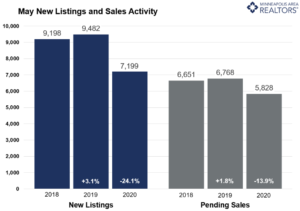
May 2020 by the numbers compared to a year ago
- Sellers listed 7,199 properties on the market, a 24.1 percent decrease from last May
- Buyers signed 5,828 purchase agreements, down 13.9 percent (4,728 closed sales, down 22.4 percent)
- Inventory levels declined 20.3 percent to 9,744 units
- Months Supply of Inventory was down 20.0 percent to0 months (5-6 months is balanced)
- The Median Sales Price rose 3.5 percent to $294,900
- Cumulative Days on Market decreased 8.9 percent to 41 days, on average (median of 16)
- Changes in Sales activity varied by market segment
- Single family sales fell 9.2 percent; condo sales were down 38.6 percent; townhome sales declined 18.4 percent
- Traditional sales decreased 13.2 percent; foreclosure sales dropped 4.3 percent; short sales fell 30.8 percent
- Previously owned sales were down 13.8 percent; new construction sales declined 0.5 percent
Record high showings the bright spot in April housing numbers
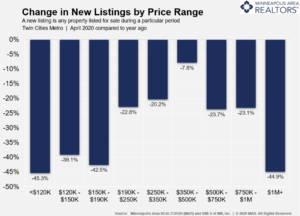
(May 21, 2020) – According to new data from the Minneapolis Area REALTORS® and the Saint Paul Area Association of REALTORS®, both buyer and seller activity was down in April, but the number of residential showings has reached a new high for the year.Both new listings and pending purchase activity was down in April compared to a year ago, but the declines varied dramatically by price range. For homes priced between $350,000 and $500,000, for example, sellers listed just 7.8 percent fewer homes than last April. Homes priced over $1,000,000, however, saw a 44.9 percent decrease in new listings. New listings at the far-affordable end of the market also saw notable declines.
“March started off strong and that strength returned later in April and into May; however, the latter half of March and the start of April saw set-backs due to COVID-19,” said Patrick Ruble, President of the Saint Paul Area Association of REALTORS®. “REALTORS® are busy, and we’ve seen gains for both buyers and sellers in late-April and May.”
The price gains in April may surprise some. In fact, April was the first month on record where the median home price surpassed $300,000. Home prices and closed sales both rose in April, reflecting purchase agreements signed in February and the first half of March. Homes actually sold more quickly this April than last, as health concerns held back some less serious buyers but motivated buyers who remained active and committed.
“We expected much of the pull-back resulting from COVID-19 would show up in April, so the shift isn’t that surprising,” said Linda Rogers, President of the Minneapolis Area REALTORS®. “But showings are a leading indicator for purchase activity and they’ve reached new highs for the year. We expect this to translate into stronger sales activity once the health situation stabilizes.”
The recent job losses have impacted some market segments more than others. Buyers in the affordable brackets are more likely to be impacted by job losses in the leisure, hospitality or retail space, while those looking in the luxury brackets may be impacted by volatility in equity markets. The middle-market ranges performed the best, perhaps propped up by salaried professionals who can work from home.
For April, the median Twin Cities home price was up 8.9 percent to $305,000, a new high for the metro area. Mortgage rates on a 30-year fixed loan are around 3.4 percent—just about the lowest they have ever been. While recessions can pause market activity, they typically only have a minor impact on home prices. The undersupplied market—especially at the affordable end—should also prevent any price softening.
April 2020 by the numbers compared to a year ago
- Sellers listed 5,967 properties on the market, a 22.9 percent decrease from last April
- Buyers signed 4,612 purchase agreements, down 20.1 percent (4,609 closed sales, up 3.5 percent)
- Inventory levels declined 13.1 percent to 9,279 units
- Months Supply of Inventory was down 18.2 percent to8 months (5-6 months is balanced)
- The Median Sales Price rose 8.9 percent to $305,000 (over $300,000 for the first time ever)
- Cumulative Days on Market decreased 17.5 percent to 47 days, on average (median of 17)
- Changes in Sales activity varied by market segment
- Single family sales rose 11.1 percent; condo sales were down 33.2 percent; townhome sales declined 5.3 percent
- Traditional sales increased 5.0 percent; foreclosure sales dropped 33.7 percent; short sales fell 43.5 percent
- Previously owned sales were up 4.9 percent; new construction sales climbed 4.7 percent
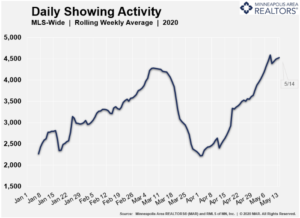
A silver lining: Some early signs of turnaround in showings
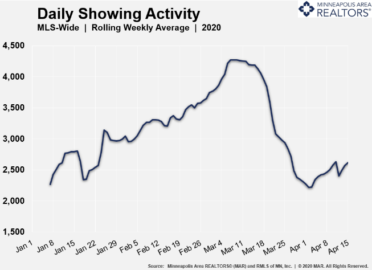
(April 17, 2020) – According to new data from the Minneapolis Area REALTORS® and the Saint Paul Area Association of REALTORS®, the number of Twin Cities residential real estate showings displayed the first signs of a turnaround since they began declining during the onset of the coronavirus in mid-March.Since reaching their valley around April 2, showings have been on the rise. As of April 10, overall showings were up 16.1 percent compared to a week earlier. Reduced activity during the Easter and Passover holidays eroded that gain slightly, but that is likely a temporary blip.
 “Despite some concerns among buyers and sellers, there’s clearly still activity occurring,” said Linda Rogers, President of Minneapolis Area REALTORS®. “It is still vital that REALTORS® continue to follow best practices for showing homes safely and to consider other options such as virtual tours.”
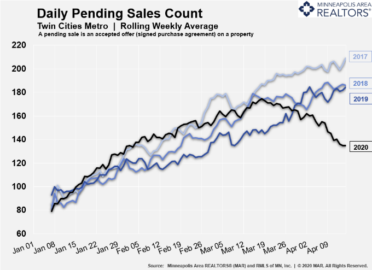
Both new listings and pending sales also saw declines in the second half of March and into April. New listings began to decline around March 26 and are now roughly 36.8 percent below their 2020 peak. The decline in buyer activity was earlier but not as severe. Pending sales began to decline around March 18 and are now about 19.1 percent below their peak.
“March was off to a strong start until the middle of the month when everything changed,” said Patrick Ruble, President of St. Paul Area Association of REALTORS®. “We even saw a double-digit gain in new listings, providing more options for buyers facing limited choices. The strength of the market preceding this crisis bodes well for a relatively quick recovery once this crisis is over.”
The monthly report for March, with its 16.0 percent gain in new listings and 11.2 percent increase in pending and closed sales, paints only a partial picture of COVID-19’s impact on the market. The numbers don’t fully reflect the effect of the stay-at-home order and school closures which occurred in the second half of the month. And most March sales were for purchase agreements that were finalized in January and February. The April numbers will offer a far more accurate view of COVID-19’s impact on the Twin Cities housing market – from sales, listings and inventory to market times and home prices.
For March, the median Twin Cities home price was up 8.0 percent to $297,000. Mortgage rates on a 30-year fixed loan are now around 3.4 percent—just about the lowest they’ve ever been. While recessions can pause market activity, they typically have only a minor impact on home prices. The undersupplied market—especially at the affordable end—should also shield prices.
March 2020 by the numbers compared to a year ago
- Sellers listed 7,220 properties on the market, a 16.0 percent increase from last March
- Buyers signed 5,148 purchase agreements, up 11.2 percent (4,155 closed sales, also up 11.2 percent)
- Inventory levels declined 11.3 percent to 8,597 units
- Months Supply of Inventory was down 15.0 percent to7 months (5-6 months is balanced)
- The Median Sales Price rose 8.0 percent to $297,000
- Cumulative Days on Market decreased 9.1 percent to 60 days, on average (median of 26)
- Changes in Sales activity varied by market segment
- Single family sales rose 13.5 percent; condo sales were up 8.4 percent; townhome sales increased 8.1 percent
- Traditional sales increased 13.6 percent; foreclosure sales dropped 34.6 percent; short sales fell 9.5 percent
- Previously owned sales were up 13.5 percent; new construction sales climbed 5.9 percent
For more information on weekly and monthly housing numbers visit www.mplsrealtor.com.
From The Skinny Blog.
Showings decline in Twin Cities amid coronavirus concerns
(March 19, 2020) – According to new data from the Saint Paul Area Association of REALTORS® and the Minneapolis Area REALTORS®, the number of Twin Cities residential real estate showings declined in most price ranges during the week ending March 17 compared to the previous week. The declines, which come amid the coronavirus pandemic, were most prominent in the higher price brackets.
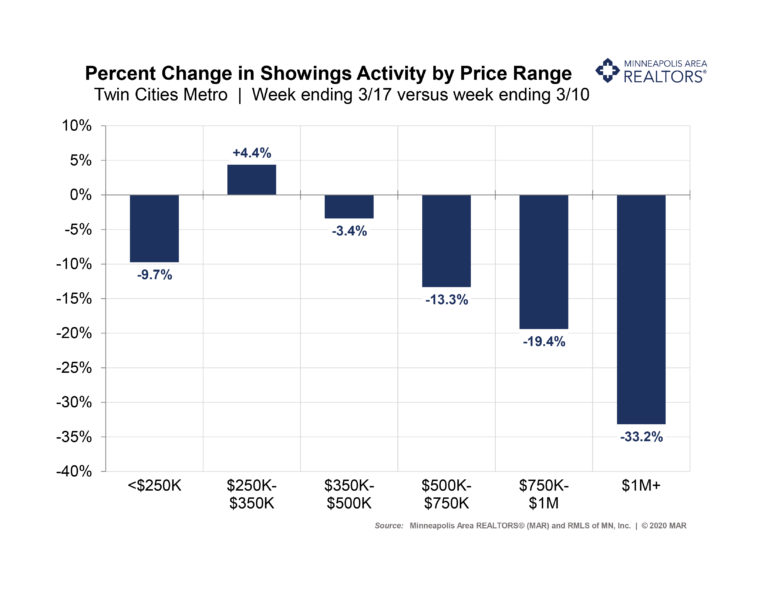
Showings decreased by 9.7% in the under $250,000 price bracket, where inventory is down significantly. The in-demand $250,000 to $350,000 price range was the only one that had an increase in showings. Homes priced over $1million saw a 33.2% decline in showings.
“It appears that concerns about spreading the coronavirus are starting to have an impact on our market,” said Patrick Ruble, President of the Saint Paul Area Association of REALTORS®. “REALTORS® are encouraged to follow the most current best practices in accordance with their brokers, which should be following the CDC guidelines. This includes activities such as open houses, active listings and interactions with clients and visitors.”
New listings, which are usually on the rise this time of year, have been weakening over the past couple of weeks. Active listings, or the total number of homes for sale, have also started softening in recent days. On a positive note pending sales, or the number of signed purchase agreements, remained strong during this period.
“Buyers in the more affordable price ranges embraced the low rates and mild weather,” said Linda Rogers, President of Minneapolis Area REALTORS®. “We are noticing fewer showings in the higher price points, reflecting both buyer and seller concerns and time will tell how the rest of the month plays out.”
In other news, the February numbers showed buyer and seller activity were up compared to last year. But the gains appear deceptively large due to weather challenges that held activity back in February 2019. Even so, the gains—particularly for pending sales—also outpaced 2018 levels.
Seller listing activity effectively recovered after the snow and melt we saw in 2019 and then increased slightly over 2018 levels. The nearly 24.0 percent increase in pending sales—or the number of signed purchase agreements—goes beyond weather. Mortgage rates have fallen throughout the year and spent most of February below 3.5 percent, compared to around 4.5 percent in February 2019. The Federal Reserve recently acted to further lower interest rates to limit the downside risks of COVID-19 to the economy. Home sales help the economy and low rates help to hedge against declining affordability brought on by rising prices.
February 2020 by the numbers compared to a year ago

- Sellers listed 5,293 properties on the market, a 19.9 percent increase from last February
- Buyers signed 4,267 purchase agreements, up 23.9 percent (3,016 closed sales, up 6.0 percent)
- Inventory levels declined 12.4 percent to 7,879 units
- Months Supply of Inventory was down 11.1 percent to 1.6 months (5-6 months is balanced)
- The Median Sales Price rose 6.3 percent to $282,000
- Cumulative Days on Market decreased 2.9 percent to 67 days, on average (median of 40)
- Changes in Sales activity varied by market segment
-
- Single family sales rose 4.9 percent;condo sales fell 1.4 percent; townhome sales rose 17.7 percent
- Traditional sales increased 6.9 percent; foreclosure sales rose 8.5 percent; short sales fell 5.9 percent
- Previously owned sales were up 6.3 percent; new construction sales climbed 16.8 percent
For more information on weekly and monthly housing numbers visit www.mplsrealtor.com.
From The Skinny Blog.
Favorable rates and weather spur home buying in Twin Cities
February 22, 2020
Latest housing report also shows falling inventory and rising prices
According to the latest housing report from the Minneapolis Area REALTORS® and the Saint Paul Association of REALTORS®, Twin Cities residential real estate started 2020 on solid but still uneven footing. Buyers were eager to ignite the spring market early, spurred by incredibly low mortgage rates and favorable weather, especially compared to last year. Tempering the market are falling inventory and rising prices.
“Buyers were again spoiled by rates that no one expected would be this low,” said Linda Rogers, President of Minneapolis Area REALTORS®. “That’s fueled more sales activity but we’re still missing the inventory piece.”
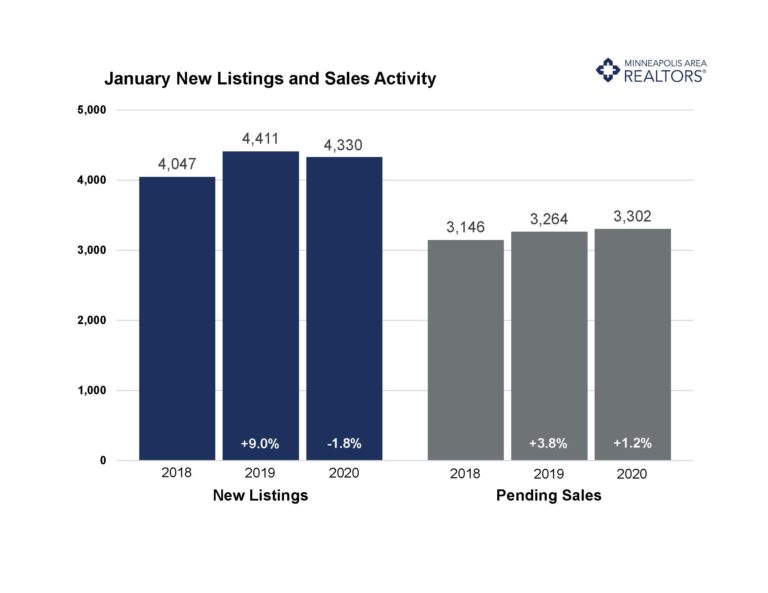
Sellers listed fewer homes for sale while buyers signed more purchase agreements and closed more deals. As a result, the number of homes for sale was almost 15 percent lower than last January. The supply squeeze wasn’t felt evenly across price points, though. While inventory of homes priced below $250,000 fell, the number of listings priced between $250,000 and $500,000 as well as $500,000 to $1,000,000 increased last month.
“The year is off to a solid start and metro area communities each have a unique story to tell when it comes to housing availability and price,” said Patrick Ruble, President of St. Paul Area Association of REALTORS®.
Some of the most competitive markets experiencing strong price growth are those with relatively higher levels of affordable or entry-level homes, such as Fridley, Vadnais Heights, Richfield, Brooklyn Center and Bloomington. That’s where multiple offers and homes selling for over list price are more common. Both millennial first-time buyers and downsizing empty nesters are competing over this limited supply of affordable homes close to the core cities. The move-up and upper-bracket home price segments are more balanced and better supplied.
January 2020 by the numbers (compared to a year ago)
- Sellers listed 4,330 properties on the market, a 1.8 percent decrease from last January
- Buyers closed on 2,870 homes, a 5.4 percent increase
- Inventory levels declined 14.9 percent to 7,595 units
- Months Supply of Inventory was down 16.7 percent to 5 months (5-6 months is balanced)
- The Median Sales Price rose 4.2 percent to $270,000
- Cumulative Days on Market increased 1.5 percent to 66 days, on average (median of 43)
- Changes in Sales activity varied by market segment
- Single family sales rose 5.5 percent; condo sales fell 3.5 percent; townhome sales rose 11.7 percent
- Traditional sales increased 7.1 percent; foreclosure sales dropped 26.0 percent; short sales fell 52.6 percent
- Previously owned sales were up 5.5 percent; new construction sales climbed 11.1 percent
Despite tight market Twin Cities real estate activity up in 2019
The Twin Cities housing market continued to show steady growth in 2019 according to the annual market wrap-up from the Minneapolis Area REALTORS® and the St. Paul Area Association of REALTORS®. At a joint news conference in St. Paul, the associations announced a growing economy, favorable rates and a persistent scarcity of homes for sale have uplifted home prices for eight consecutive years. Lower mortgage rates helped offset declining affordability brought on by rising home prices.
“In our market, like others across the country, lack of housing inventory has been a recurring theme for buyers. It continued in 2019 as buyers, looking for entry level options and more affordable choices, felt the most pressure. Buyers, however, have remained persistent resulting in gains, both in sales volume and price appreciation,” said Patrick Ruble, President of the Saint Paul Area Association of REALTORS®. “Fortunately, the region’s economy continues to grow, unemployment remains low and we are seeing growth in wages. We have a healthy market and look forward to some of the sticking points, such as the limited inventory, easing in the coming year.”
Sellers reversed three years of declines with a modest 0.2 percent increase in new listings in 2019. Buyers overturned a sales decline in 2018 with a 0.8 percent increase in purchases. The ongoing housing shortage has led to a competitive environment where multiple offers are commonplace, frustrating some consumers. Therefore, sellers are receiving strong offers in near record time. Market times did, however, increase 2.1 percent from 2018 while the ratio of sold to list price declined 0.1 percent. These two metrics could be early indicators of a shifting balance.
“Overall 2019 was a good year for real estate. After a slow start, activity picked up once rates fell back below 4.0 percent mid-year,” said Linda Rogers, President of the Minneapolis Area REALTORS®. “The second half of the year saw consistent sales gains, as record prices and declining affordability were offset by favorable rates and wage growth. Buyers were persistent despite tight inventory—particularly under $300,000. That’s no surprise, as the Twin Cities are a wonderful place to live, work and play.”
Rates remained attractive during the year. Despite starting the year around 4.5 percent, mortgage rates fell to 3.7 by year-end. Single family and new construction sales led the pack; so it’s no surprise that four-bedroom homes and homes over 2,500 square feet saw the largest gains. There’s still a “tale of two markets” dynamic at play: the under $350,000 or first-time buyer segment is severely undersupplied but also in high demand. The move-up market for homes over $500,000 is much better supplied, giving buyers more options and negotiating room.
“The Twin Cities housing market is a reflection of what’s been happening statewide,” said Bob Clark, President of the Minnesota Association of REALTORS®. “Realtors across Minnesota finished the year with slight increases in closings, new listings and continued growth in home prices.”
2019 by the Numbers
Sellers listed 76,345 properties on the market, a 0.2 percent increase from 2018
Buyers closed on 59,843 homes, a 0.8 percent increase from 2018
Inventory levels for December fell 19.6 percent compared to 2018 to 7,431 units
Months Supply of Inventory was down 21.2 percent o 1.5 months
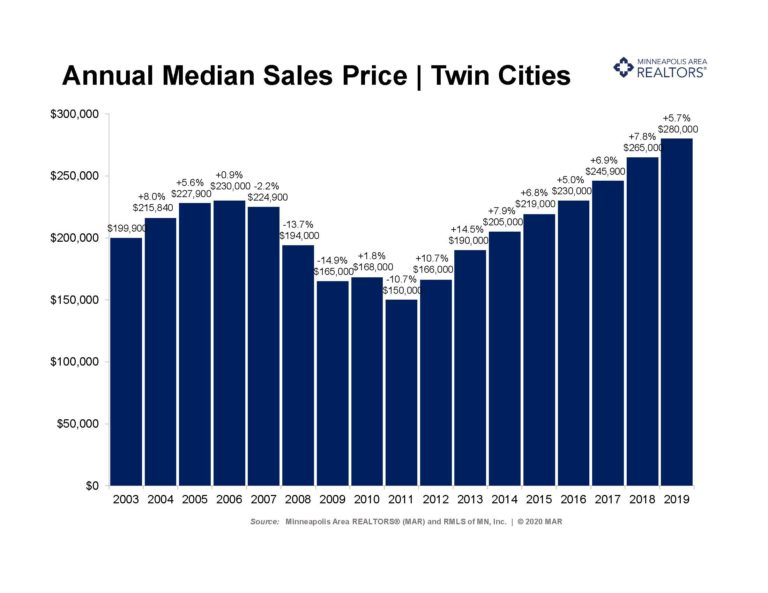
The Median Sales Price rose 5.7 percent to $280,000, a record high
Cumulative Days on Market increased 2.1 percent to 49 days, on average (median of 23)
Changes in sales activity varied by market segment
Single-family sales increased 1.5 percent; condo sales fell 1.7 percent; townhome sales were down 1.4 percent
Traditional sales rose 1.8 percent; foreclosure sales decreased 31.9 percent; short sales fell 35.2 percent
Previously-owned sales increased 0.3 percent; new construction sales rose 6.9 percent
For other year-end residential real estate information and for stand-alone December 2019 data, visit www.mplsrealtor.com.
November a mixed bag; new listings up, sales down
December 18, 2019
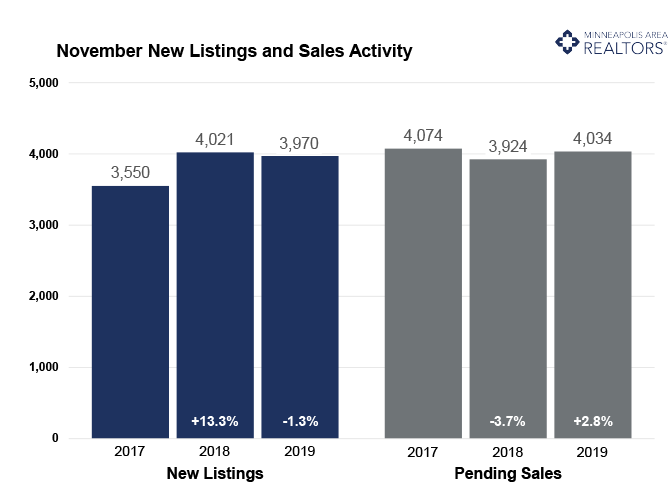
The Twin Cities real estate market showed a mostly positive but slightly mixed bag of results for November. New listings were up 0.1 percent year-to-date but down slightly in November. Helping to offset that decline was a 25.0 percent gain in newly built homes from last November. That’s because a builder doesn’t have to buy a home after selling one. Despite a sellers’ market and depending on price point, sellers still face the challenge of securing the next property while listing their current home.
Closed sales were also down slightly in November, but year-to-date closings are almost even with 2018. Sales have risen for the previous four consecutive months. Additionally, pending sales—a signed contract indicating a forthcoming closing—have now risen for five consecutive months, including November. This points to solid demand heading into the new year. Despite tight inventory, surprisingly low borrowing rates are helping to support this demand.
The number of homes for sale declined overall, but most price ranges have shown some growth this year. Over the last 12 months, housing inventory levels have increased for homes priced between $200K-$300K, $300K-$500K and over $500K but fell for homes under $200K. That first-time buyer segment still hasn’t seen supply growth.
The median home price in the Twin Cities has risen for 93 months or nearly 8 years, reaching new record highs every year since 2016. This isn’t the case for every market segment or area. The supply-demand imbalance pushes prices higher along with a changing mix of homes selling. There’s been growth in luxury activity and in square footage.
Market times remain brisk and near record lows, but there were a few monthly increases in 2019. Homes priced under $250K sold in a median of 25 days, while that figure was 91 days for homes over $1M.
November 2019 by the Numbers (compared to a year ago)
• Sellers listed 3,970 properties on the market, a 1.3 percent decrease from last November
• Buyers closed on 4,672 homes, a 0.8 percent decrease
• Inventory levels decreased 9.2 percent from last November to 10,011 units
• Months Supply of Inventory was down 9.1 percent to 2.0 months
• The Median Sales Price rose 5.6 percent to $279,900
• Cumulative Days on Market declined 1.9 percent to 51 days, on average (median of 29)
• Changes in Sales activity varied by market segment
o Single family sales rose 2.1 percent; condo sales decreased 10.7 percent; townhome sales fell 4.9 percent
o Traditional sales increased 0.7 percent; foreclosure sales dropped 34.7 percent; short sales were flat
o Previously owned sales were flat; new construction sales climbed 5.3 percent
Quotables
“We’re on solid footing heading into year-end,” said Todd Urbanski, President of Minneapolis Area REALTORS®. “More inventory would be nice, but rates are fantastic, the economy is still growing and consumers are confident.”
“National news headlines have little to do with our local market,” said Linda Rogers, President-Elect of Minneapolis Area REALTORS®. “Our state and local economies are hardy and diversified, good news for home buyers.”
From The Skinny Blog.
Listings, Sales, Prices: All Rise
November 19, 2019
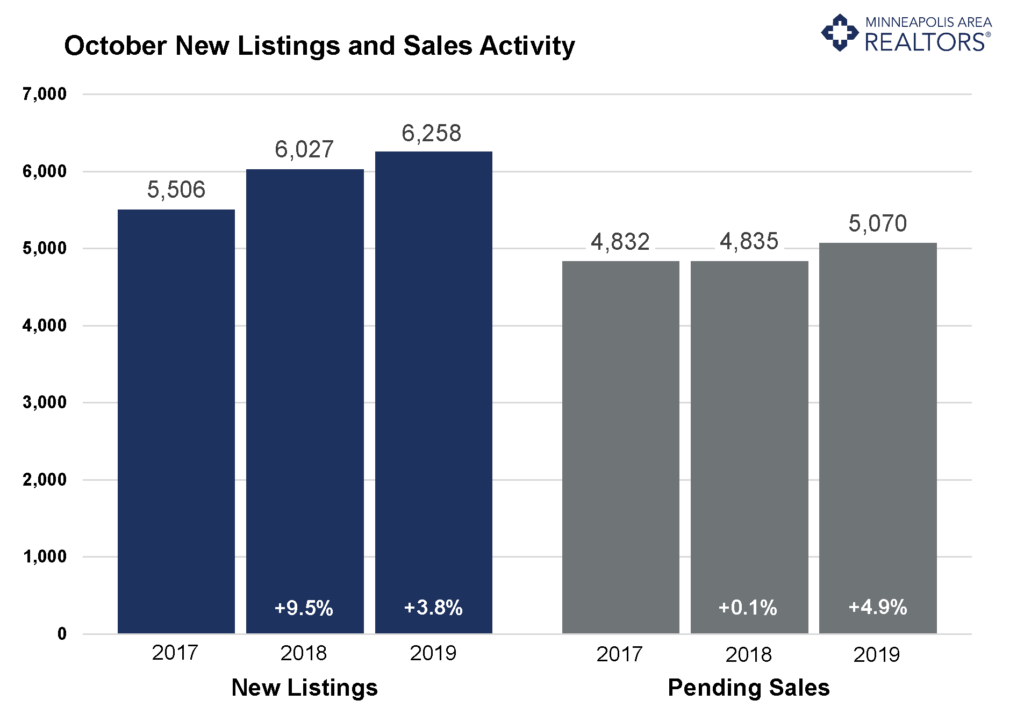
The Twin Cities real estate market started the fourth quarter of 2019 on a strong note with buyer and seller activity rising in October compared to 2018. Buoyed by historically low interest rates, the number of new listings and pending sales rose last month and the median price of a home also increased.
New listings increased by 3.8 percent last month to nearly 6,300 properties on the market. Pending home sales increased 4.9 percent in October, continuing their steady rise since mortgage rates dipped below 4.0 percent in June. The increase also puts the number of pending sales in positive territory for the year. Continuing the market’s upward trend, the median price of a home in the Twin Cities rose to $280,000 in October, a 5.7 percent increase over last year.
October reversed a trend of rising days on market and continued September’s reversal of sellers accepting a slightly lower share of their list price compared to last year. With increased sales activity, quicker market times and sellers yielding strong offers, it’s no wonder more sellers decided to list. There are still some signs that the market is rebalancing, but buyers awaiting spooky news could see their patience tested based on October numbers.
While inventory has grown this year, supply remains tight for first-time buyers and downsizing households competing for homes under $350,000. At this price point, multiple offers and homes selling for over list price in record time is still common. Builders struggle to replenish inventory due to high costs, a labor shortage and regulatory constraints. The shortage of affordable homes has prompted many owners to stay put. With 2.3 months of supply, the Twin Cities market is still significantly undersupplied.
October 2019 by the Numbers (compared to a year ago)
- Sellers listed 6,258 properties on the market, a 3.8 percent increase from last October
- Buyers closed on 5,391 homes, a 1.3 percent increase
- Inventory levels decreased 5.8 percent from last October to 11,607 units
- Months Supply of Inventory was down 8.0 percent to 3 months
- The Median Sales Price rose 5.7 percent to $280,000
- Cumulative Days on Market declined 4.2 percent to 46 days, on average (median of 25)
- Changes in Sales activity varied by market segment
-
- Single family sales rose 5.5 percent; condo sales increased 1.4 percent; townhome sales fell 0.5 percent
- Traditional sales increased 4.8 percent; foreclosure sales dropped 21.1 percent; short sales fell 55.6 percent
- Previously owned sales were up 4.4 percent; new construction sales climbed 2.6 percent
Quotables
“Interest rates are boosting buyer confidence,” said Todd Urbanski, President of Minneapolis Area REALTORS®. “Consumers may also be realizing that some of their fears around the market and economy could be overstated.”
“The latest figures show our key metrics returning to growth,” said Linda Rogers, President-Elect of Minneapolis Area REALTORS®. “We expect Minnesota and the Midwest to fare well should that change.”
From The Skinny Blog.
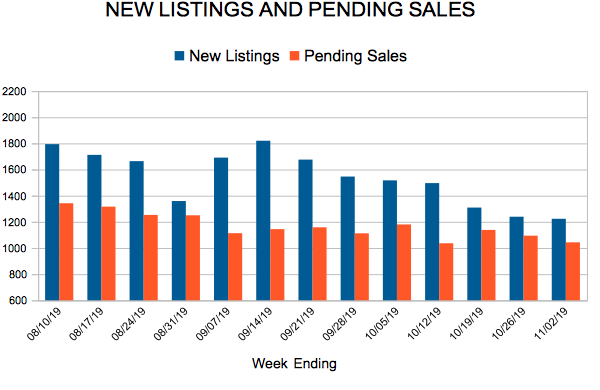
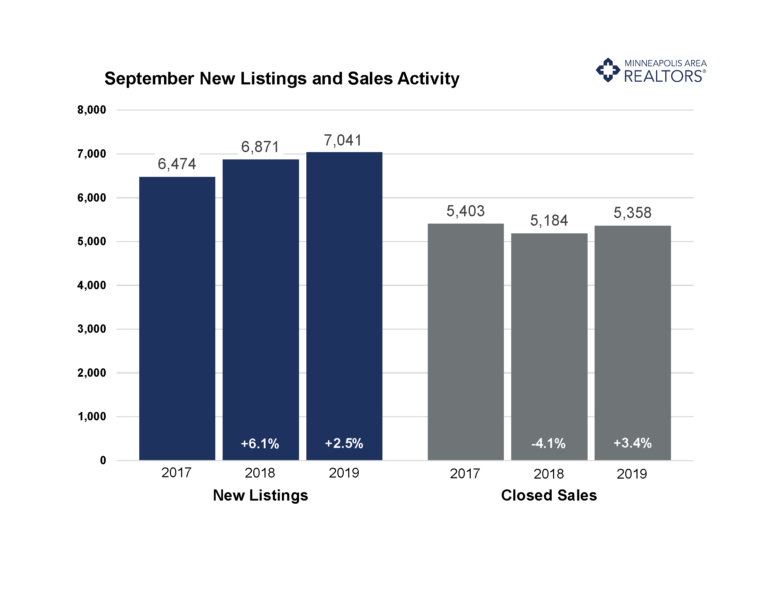
New Listings and Pending Sales
Sales, prices still rising despite some changes this year
The latest numbers for Twin Cities residential real estate show a stable market with some ongoing signs of transition. Prices are still rising, supply is still tight, and demand has recovered even while market times have lengthened. Even though more buyers are closing on homes, the urgency has subsided somewhat. Days on market rose 2.4 percent from last September, marking the fifth year-over-year increase in the last seven months. Market times remain swift despite modest increases. Sales rose 3.4 percent and the median sales price increased 6.6 percent to $279,250. Pending sales—a measure of signed contracts and future demand—rose 2.9 percent. Both pending and closed sales are down slightly for the year so far, but that may change. New listings were up 2.5 percent, helping some buyers take advantage of historically low rates. Sellers have been accepting a slightly lower share of their list price compared to the year prior for seven of the last eight months—with September bucking that trend. This, along with other indicators, suggests the market is rebalancing in a way that could benefit buyers.
The number of active listings for sale is up over the last 12 months and for most of 2019. Even so, the market remains tight—particularly for first-time buyers and downsizers competing in the under $300,000 segment where multiple offers and homes selling for over list price remain commonplace. Despite the demand, builders struggle to replenish inventory in that undersupplied segment due to high land and material costs combined with a significant labor shortage and tricky regulations. The shortage of affordable homes has led to an increase in remodeling as people are staying in their homes longer. It’s challenging to find comparable home at a similar payment in the desired location. With just 2.5 months of supply, the Twin Cities is still significantly undersupplied.
September 2019 by the Numbers (compared to a year ago)
- Sellers listed 7,041 properties on the market, a 2.5 percent increase from last September
- Buyers closed on 5,358 homes, a 3.4 percent increase
- Inventory levels decreased 5.6 percent from last September to 12,478 units
- Months Supply of Inventory was down 7.4 percent to 5 months
- The Median Sales Price rose 6.6 percent to $279,250
- Cumulative Days on Market rose 2.4 percent to 43 days, on average (median of 22)
- Changes in Sales activity varied by market segment
-
- Single family sales rose 5.5 percent; condo sales increased 1.4 percent; townhome sales fell 0.5 percent
- Traditional sales increased 4.8 percent; foreclosure sales dropped 21.1 percent; short sales fell 55.6 percent
- Previously owned sales were up 4.4 percent; new construction sales climbed 2.6 percent
Quotables
“Attractive interest rates have unleashed some of the pent-up demand from earlier this year,” said Todd Urbanski, President of Minneapolis Area REALTORS®. “But each price point, product type and area is unique.”
“Buyers are still very much motivated despite some challenges,” said Linda Rogers, President-Elect of Minneapolis Area REALTORS®. “It really shows the resilience of our region and the value of homeownership.”
From The Skinny Blog.
