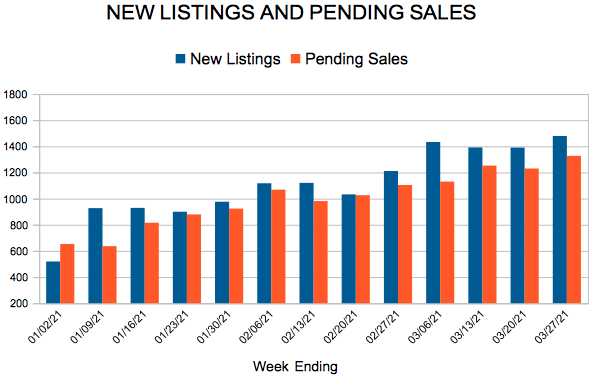
New Listings and Pending Sales
(March 17, 2021)
– According to new data from the Minneapolis Area REALTORS® and the Saint Paul Area Association of REALTORS®, sales activity in the 16-county Twin Cities metro continues to climb above 2020 levels while the number of signed purchase agreements flattened out. Closed sales rose 4.8 percent from last February, which was the highest figure since at least 2003. While new signed purchase agreements were also the strongest since 2005, they were down 0.1 percent from last year, suggesting low supply could be constraining sales.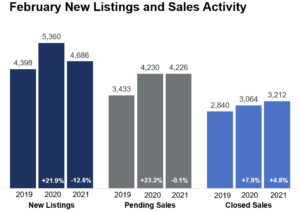
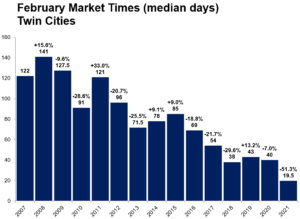
The number of homes for sale in February was down 46.3 percent compared to a year ago. That amounts to 0.8 months of supply, while a balanced market has 4-6 months of supply. At 100.1 percent of list price, sellers are still benefiting from historically strong offers, often over asking price and with multiple bids. Homes are selling in record time—half the listings in February sold in under 19.5 days. Home prices rose notably, up 11.5 percent from last February. Historically low rates can partly offset rising prices.
“With so many buyers vying over a shrinking pool of listings, well-priced and well-staged homes don’t spend much time on the market,” said Tracy Baglio, President of the Saint Paul Area Association of REALTORS®. “That means buyers have to come out swinging right out of the gate with their best offer in order to be successful.”
Though pending sales were down 0.1 percent metro-wide, they were up 23.3 percent in Minneapolis and 8.4 percent in St. Paul, indicating buyer interest remains strong in the urban core. Condos also saw the strongest demand growth in both pending and closed sales. New construction sales rose 32.5 percent compared to a 2.6 percent increase for previously owned homes. Sales of luxury properties ($1M+) have been strong—up 53.1 percent from last February.
February 2021 by the numbers compared to a year ago
Sales up, price growth strong, market times fast, but new listings down and supply levels very low
(February 17, 2021) – According to new data from the Minneapolis Area REALTORS® and the Saint Paul Area Association of REALTORS®, buyer activity in the 16-county Twin Cities metro continues to climb above 2020 levels. Closed sales rose 14.6 percent from last January and new signed purchase agreements were up 5.6 percent over last year. That marks the strongest January pending sales since 2005 and the highest closed sales figure since at least 2003.

Despite the unyielding commitment from buyers in 2020, there are not enough homes on the market—particularly in the affordable ranges—to satisfy the historic demand. Sellers listed 8.8 percent fewer homes than January 2020, further shrinking an already historically low inventory of available homes.
“Last year was incredibly strong and so far 2021 is keeping up the pace,” according to Todd Walker, President of Minneapolis Area REALTORS®. “Rates are as attractive as they’ve ever been and the demand is persistent, but the challenge is still the lack of supply.”
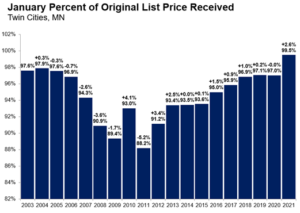
The number of homes for sale in January was down 42.6 percent compared to a year ago. That amounts to 0.9 months of supply, while a balanced market has 4-6 months of supply. This dynamic has given rise to four other trends: sellers are getting historically strong offers, homes are selling in record time, multiple offers and competitive bidding have become commonplace and home prices are rising quickly relative to incomes.
“There are many motivated buyers out there but not nearly enough homes for them on the market,” said Tracy Baglio, President of the Saint Paul Area Association of REALTORS®. “Proper pricing is still critical, but sellers are accepting offers that are at or very close to list price, occasionally above it in the first-time buyer segments.”
Pending sales were up 39.4 percent in Minneapolis and 14.0 percent in St. Paul, indicating buyer interest remains quite strong in the core cities. Perhaps surprisingly, condos saw the strongest sales growth followed by single family and then townhomes. New construction sales rose 12.2 percent compared to a 16.0 percent increase for previously owned homes. Sales of luxury properties ($1M+) have been rallying—up 75.0 percent from last January.
For more information on weekly and monthly housing numbers visit www.mplsrealtor.com or www.spaar.com
January 2021 by the numbers compared to a year ago
Seller activity rose a modest 0.1 percent from 2019 while closed sales were up 7.7 percent. That marks the highest sales figure since at least 2003 and the highest new listings count since 2016. Listing activity was constrained due to health concerns, remodeling activity, a lack of options and homeowners staying in their homes longer.
“Predictably, the result of record sales combined with ultra-low inventory meant rising prices and sellers accepting stronger offers in less time,” according to Tracy Baglio, President of the Saint Paul Area Association of REALTORS®.
Governor Walz’s shelter-in-place order paused market activity in April and May, which created pent-up demand that pushed the spring market into summer and the summer market into fall. Buyers were still more eager to purchase than sellers were to list, meaning multiple offers remained commonplace—particularly at the more affordable price points where the inventory shortage is even more pronounced.
“Despite several challenges, the Twin Cities housing market exceeded all expectations,” said Todd Walker, President of Minneapolis Area REALTORS®. “Inventory remained a hurdle, but homeowners have never had so much equity in their homes and buyers haven’t seen rates this low in 50 years, offsetting rising prices.”
The median sales price rose 8.9 percent to $305,000, a record high. On average, sellers obtained 99.8 percent of their list price—the highest since at least 2003. Homes sold quickly. Half the sales had accepted offers in under 18 days. Importantly, all areas, price points and property types are unique.
Signed contracts rose 10.0 percent in Minneapolis and 16.4 percent in St. Paul, suggesting core cities remain attractive. With prices slightly lower, market times higher and offers weaker, the condo market continues to lag other segments. Aided by favorable jumbo rates and a recovered stock market, sales of luxury properties ($1M+) have been soaring higher—up 25.4 percent from 2019.
One thing is clear: the housing market continues to outperform, despite several headwinds.
2020 by the numbers (compared to 2019)
• Sellers listed 76,348 properties on the market, a 0.1 percent increase from 2019
• Buyers closed on 64,479 properties, up 7.7 percent (65,770 pending sales, up 9.7 percent)
• The Median Sales Price rose 8.9 percent to $305,000
• Inventory levels fell 39.3 percent to 5,080 units
• Months Supply of Inventory was down 47.1 percent to 0.9 months (5-6 months is balanced)
• Days on Market decreased 12.2 percent to 43 days, on average (median of 18, down 21.7 percent)
• Changes in Sales activity varied by market segment
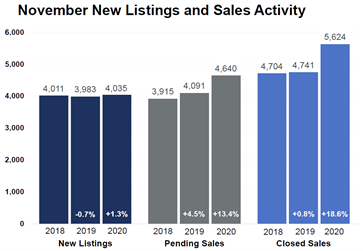
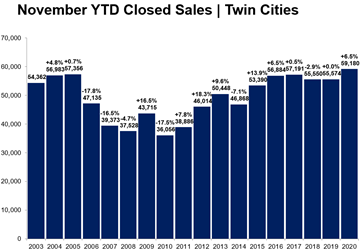
(December 17, 2020) – According to new data from the Minneapolis Area REALTORS® and the Saint Paul Area Association of REALTORS®, the growth in buyer and seller activity in the 16-county Twin Cities metro continues to climb above 2019 levels. Seller activity rose 1.3 percent from last November while new purchase agreements were up 13.4 percent over last year. That marks the strongest November pending sales figure since 2004 and the highest closed sales since at least 2003.
This year, the fall and winter markets are behaving more like a spring market since activity was delayed from the spring and summer months. While sellers only listed slightly more units than last November, pending and closed sales were up significantly. Pending sales often act as a leading indicator of future demand while closings lag.“The Twin Cities housing market continues to exceed expectations,” according to Patrick Ruble, President of the Saint Paul Area Association of REALTORS®. “Despite record sales figures, the lack of adequate supply—particularly affordable units—continues to frustrate buyers.”
Historically low mortgage rates, shifting work and learning patterns, health concerns and other factors are driving this sellers’ market. While all areas and price points are unique, sellers are getting strong offers early on. On average, sellers obtained 100.2 percent of their original list price—the highest November figure since at least 2003. At a median of 15 days, homes went under contract in record time, and 48.3 percent faster than last November.
“It’s truly impressive that sales would reach new highs during a pandemic and an otherwise challenging year,” said Linda Rogers, President of Minneapolis Area REALTORS®. “That’s of course meant rising home prices, but luckily, ultra-low interest rates have been able to partly offset that.”
Sales were up 21.5 percent in Minneapolis and 30.8 percent in St. Paul, suggesting buyers are eager to quickly snap up any new listings. And the competitive landscape means those buyers are often going above list price. With prices slightly lower, market times higher and offers weaker, the condo market continues to lag other segments. However, sales of luxury properties ($1M+) have been soaring higher—up nearly 20.0 percent YTD. One thing is clear: the housing market continues to outperform, despite the many economic headwinds.
November 2020 by the numbers compared to a year ago
New listings and sales up, price growth accelerating, but supply levels extremely low
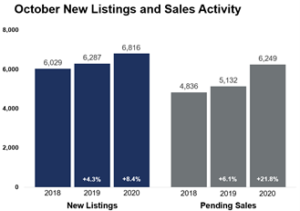
(November 19, 2020) – According to new data from the Minneapolis Area REALTORS® and the Saint Paul Area Association of REALTORS®, buyer and seller activity in the 16-county Twin Cities metro continue to outpace 2019. Seller activity rose 8.4 percent compared to last October while buyer activity was up 21.8 percent, marking the strongest October sales figure since at least 2003.
Buyers are motivated by expectations of working and spending more time at home and are also buoyed by historically low interest rates. That has resulted in a highly competitive marketplace where sellers get strong offers—sometimes above asking price—in record time and often with multiple offers. It has also caused inventory levels to plummet, frustrating many buyers.
“Buyers are still out in force, which is fairly unusual for this time of year when things typically quiet down,” according to Patrick Ruble, President of the Saint Paul Area Association of REALTORS®. “But the shortage of inventory and fast pace of the market are still keeping some waiting in the wings.”
Record-low mortgage rates, a desire for more space, a shortage of listings and Millennials aging into homeownership have all led to record-setting demand and rising prices among other changes. This is unusual during a recession, which impacts people differently. The mid-market move-up ranges and luxury segments have been performing better as salaried professionals have been spared much of the hardship. Conversely, many would-be buyers in the most affordable price points have been sidelined as they’re more likely to be impacted by job or income loss.
Still firmly in the driver’s seat, sellers, on average, accepted offers at 100.5 percent of their original list price—matching a high for any month going back to at least 2003. At 35 days on average, homes across the metro sold 23.9 percent quicker than last October.
“Despite some earlier challenges, Minneapolis and St. Paul are still seeing strong sales growth,” said Linda Rogers, President of Minneapolis Area REALTORS®. “They’re still quite competitive.”
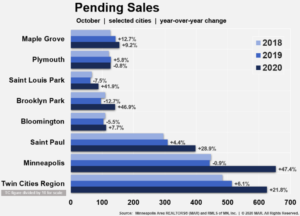
For example, new listings rose 35.5 percent in Minneapolis and 22.8 percent in St. Paul while sales were up 47.4 and 28.9 percent, respectively. Demand in the core cities is once again outpacing supply. Downtown condos are still an area of weakness, but metro-wide sales of homes priced over $1M are up over 98.0 percent from last October.
October 2020 by the numbers compared to a year ago
All information is according to the Minneapolis Area REALTORS® and Saint Paul Area Association of REALTORS based on data from NorthstarMLS. We serve the Twin Cities 16-county metro area and western Wisconsin.
New listings and sales up, price growth strong, but supply levels wearing thin
(October 19, 2020) – According to new data from the Minneapolis Area REALTORS® and the Saint Paul Area Association of REALTORS®, buyer and seller activity in the 16-county Twin Cities metro both increased from 2019.
This summer and even early fall market continue to resemble more of a spring market. Although some activity from the 2nd quarter was shifted into the 3rd quarter, buyers more than made up for the lost time and continued to ink new records. Sales activity year-to-date is already above last year. Seller activity—while still lagging—made its largest gain since March.
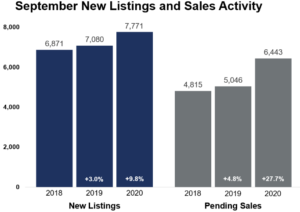
Specifically, pending sales rose 27.7 percent compared to last September to 6,443, marking at least an 18-year record high for the month going back to 2003. At 7,771, new listings were up 9.8 percent, which was the highest September since 2008.
“The demand out there in the market at this time of year is truly remarkable—especially during a pandemic,” according to Linda Rogers, President of Minneapolis Area REALTORS®. “Even though seller activity is on the rise, inventory levels remain extremely low, particularly in the affordable ranges. Serious buyers should be prepared to write strong offers quickly.”
While nothing about 2020 could be called predictable, one predictable outcome of historically strong housing demand and tight supply is rising prices. The metro-wide median sales price rose 10.8 percent to $310,000, the largest year-over-year gain since February 2018. The median sales price for new homes, however, rose 2.7 percent to $417,000 while existing home prices rose 11.1 percent to $300,000.
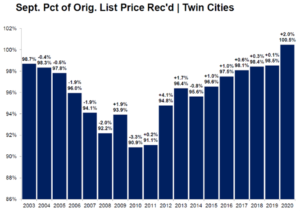
Multiple offer situations remain common as a large pool of buyers compete over a thinning stock of properties. Sellers, on average, accepted offers of 100.5 percent of their original list price—marking a new high for any month going back to at least 2003. A balanced market typically has 5-6 months of supply. At 1.7 months, sellers are still in the driver’s seat in most areas.
With such an imbalance in market forces, properties sold 31.8 percent faster than last year. Half the sales occurred in less than 15 days, tying with August for a 14-year record pace. “Even though activity is strong overall,” said Patrick Ruble, President of the Saint Paul Area Association of REALTORS®. “Every city, neighborhood, price range and property type are unique.”
For example, sales rose 41.4 percent in Minneapolis and 33.8 percent in St. Paul while new listings were up 47.8 and 17.7 percent, respectively. Seller activity in Minneapolis reached its highest level since 2007, while seller activity in the metro overall reached its highest level since 2008. The region’s condo market, however, saw new listings rise 28.9 percent while sales fell 2.6 percent. The metro condo market has 4.0 months of supply while that figure is 6.0 months in Minneapolis. Perhaps driven by attractive jumbo rates, sales of homes priced over $1M are up over 60.0 percent from last September.
September 2020 by the numbers compared to a year ago
New listings and sales up, price growth strong, but some activity from Q2 was postponed into July/August
(September 18, 2020) – According to new data from the Minneapolis Area REALTORS® and the Saint Paul Area Association of REALTORS®, buyer and seller activity in the 16-county Twin Cities metro both increased from 2019.
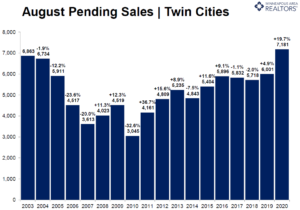
After a 12.0 percent gain in July, the number of signed purchase agreements rose 19.7 percent in August, compared to last year. At 7,181 pending sales, August 2020 had the highest recorded pending sales count for the month, and also the highest for any month of any year going back to June 2004. Although some of the pent-up demand from June and July was shifted into August, recent gains have turned year-to-date pending sales positive—now up 4.3 percent compared to 2019.
“Buyers were truly out in force last month,” according to Linda Rogers, President of Minneapolis Area REALTORS®. “The gains were widespread, with both urban and suburban locations appealing to home buyers.”
Relentless demand and diminished supply have accelerated home price growth. The median sales price in the metro rose 9.8 percent to $315,000. Excluding July of this year, that’s the strongest rate of price growth since March 2018. The median price of a newly built home was around $405,000. Historically low mortgage rates below 3.0 percent can partly offset affordability challenges caused by rising prices.
Despite a modest gain in new listings from last August, buyer demand continued to overwhelm sellers. Multiple offer situations are commonplace, and many sellers are accepting offers above list price. In fact, sellers received, on average, 100.3 percent of their original asking price—matching the 18-year record high from June 2018. A balanced market typically has 5-6 months of supply. At just 1.7 months, sellers are still in the driver’s seat.
As sales hit a new high, market times reached a new low. Half of the sales occurred in less than 15 days. “People are searching high and low for properties that meet their needs,” said Patrick Ruble, president of the Saint Paul Area Association of REALTORS®. “Attractive rates and a lack of supply means homes won’t last long on the market.”
While an expectation of prolonged tele-commuting has encouraged some to seek more space farther out, it’s notable that Minneapolis and St. Paul saw sales increase 28.1 and 29.2 percent respectively. New listings were also up notably in both cities. Condo sales rose 1.4 percent across the metro but were up 5.6 percent in Minneapolis and down 17.3 percent in St. Paul. The luxury segment has performed quite well recently. Metro-wide sales over $1M surged 51.1 percent from last August.
AUGUST 2020 BY THE NUMBERS COMPARED TO A YEAR AGO
New listings up, price growth accelerates, but some activity from Q2 was postponed into July
(August 20, 2020) – According to new data from the Minneapolis Area REALTORS® and the Saint Paul Area Association of REALTORS®, buyer and seller activity in the 16-county Twin Cities metro both increased from 2019.
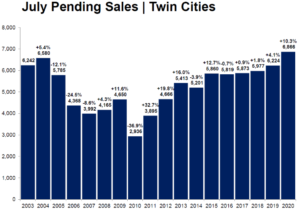
After double-digit declines in April and May, the number of signed purchase agreements rose 7.5 percent in June and another 10.3 percent in July, both compared to last July. At 6,866, July 2020 saw the highest pending sales figure since at least 2003, and likely longer. However, some of the pent-up demand from April and May was shifted into June and July, meaning sellers accepted about as many offers this July as they typically have in May of each of the prior four years. Nevertheless, the gain has turned even year-to-date pending sales positive—now up 1.3 percent compared to 2019.
“With interest rates at record lows, in some cases below 3.0 percent, we are experiencing strong demand from buyers to lock in their purchases,” said Patrick Ruble, president of the Saint Paul Area Association of REALTORS®. “If not for the pandemic, some of these accepted offers in July that set new records might have taken place in May or June.”
Although new listings increased 0.8 percent from last July, sellers struggled to keep up with all the demand. Those that did sell received, on average, 100.1 percent of their original asking price—the 2nd highest figure on record since 2003 after June 2018. Price growth also accelerated; the median price jumped 10.4 percent to $312,500. Record-low interest rates can partly offset declines in affordability spurred by rising prices.
“July was an undeniably strong month, particularly in light of some of the headwinds,” according to Linda Rogers, President of Minneapolis Area REALTORS®. “Most areas saw sales growth and other improvements, including both large core cities, where buyers continued to outbid each other.”
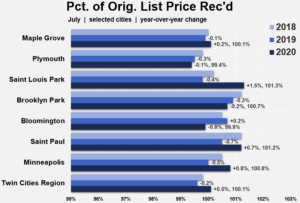
Minneapolis sellers received offers that were on average 100.8 percent of their list price. In other words, sellers got more than their list price. In St. Louis Park, St. Paul and Brooklyn Park the figures were 101.3, 101.2 and 100.7 percent respectively. Both buyer and seller activity were up double-digits in both Minneapolis and St. Paul.
Some buyers are opting for newer, farther-out suburban subdivisions that are car-dependent and still growing but come with the latest technology and more space for tele-commuting. An uptick in condo listings can anecdotally be attributed more to health concerns and a temporary closure of businesses and limited activities than any recent unrest. More time is needed to evaluate this.
July 2020 by the numbers compared to a year ago
New Highs For Showings Suggest Further Strengthening, Though Inventory Still A Challenge
(July 16, 2020) – According to new data from the Minneapolis Area REALTORS® and the Saint Paul Area Association of REALTORS®, market activity in the 16-county Twin Cities metro continued to recover from the April and May declines.
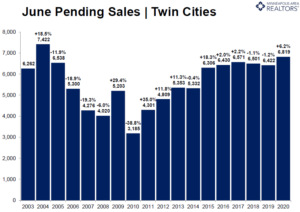
After double-digit declines in April and May, the number of purchase contracts signed in June increased 6.2 percent from last year. That brought the number of pending sales to 6,819 for the month, the highest June figure since 2004. Some of the pent-up demand from April and May was shifted into June instead of being cancelled outright.
Most of the increase was in the single-family segment. Newly built homes also saw a large gain as buyers were eyeing more space and perhaps a second home office, but also found existing options limited. Record low mortgage rates were another motivating factor for buyers—particularly first-time buyers.
“It is still very busy, but there is little inventory,” said Patrick Ruble, president of the St. Paul Area Association of REALTORS®. “Buyers enticed by historically low mortgage rates in April or May can still capitalize on those rates now; however, because there is no inventory we really need to see an increase in listings.”
Sellers are struggling to keep up, though that may be changing. After greater than 20.0 percent declines during April and May, new listings shrank 14.6 percent in June. The share of the list price that sellers received was still down slightly from last year, but at 99.6 percent, it remains at a very high level. The region had 1.8 months of supply in June, indicating a strong and undersupplied sellers’ market. A balanced market has around 5 or 6 months of supply. By contrast, the over $1M luxury segment had more than 11.0 months of supply in June.
“An encouraging showings trend alongside strong demand and a limited supply of homes should continue to support prices,” said Linda Rogers, President of Minneapolis Area REALTORS®. “While still positive, the rate of price growth moderated in May. Now June home price growth is roughly on-pace with the last 12 months.”
The Federal Reserve pushed interest rates on a 30-year fixed mortgage to around 3.0 percent—the lowest figure recorded in more than 50 years. Attractive interest rates can partly offset declines in affordability. Despite that being a motivating factor, the limited supply of homes for sale is one of the biggest challenges for buyers. Sellers are slowly gaining more confidence around health concerns, but a resurgence in COVID-19 cases could dampen that. While condo sales were still lagging, the data shows buyer and seller activity in Minneapolis is comparable to surrounding cities and suburbs.
June 2020 By The Numbers Compared To A Year Ago

Licensed In Minnesota
All information deemed reliable but not guaranteed and should be independently verified.