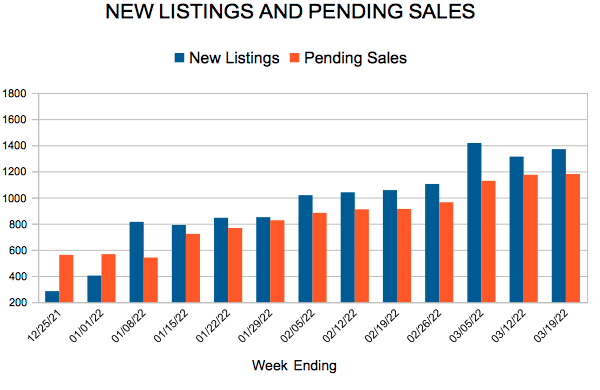
New Listings and Pending Sales
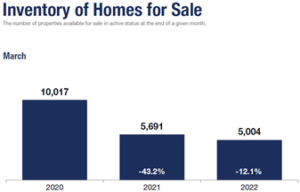
(April 15, 2022) – According to new data from Minneapolis Area REALTORS® and the Saint Paul Area Association of REALTORS®, the Twin Cities metro area set a new record median sales price of $353,000, a 7.5 percent increase from March 2021. Even though that’s the first time the metro-wide median price exceeded $350,000, the rate of increase is 30.0 percent less than it was a year ago. The ongoing inventory shortage is mostly to blame, although the 12.0 percent decline in housing inventory this March was far less than the 43.0 percent decline last March.
LISTINGS & SALES
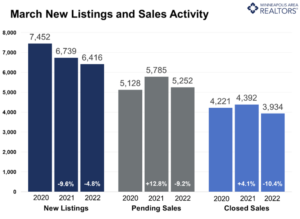
Last month sellers listed 6,416 homes on the market, 4.8 percent fewer than March 2021, but 4.2 percent greater than 2019. Some aging empty nesters are staying put and aging in place while others have chosen to remodel or expand their current home instead of listing it. Many homeowners are “married” to their interest rates and are reluctant to give up their monthly payments given rising rates. Buyers signed 9.2 percent fewer purchase agreements than March of last year and closed on 10.4 percent fewer homes. The declines partly reflect the unique strength of the 2021 market but also possibly a reaction to increased mortgage rates.
The monthly payment on a $350,000 home with 10.0% down increases by $187 per month when rates move from 4.0 to 5.0 percent. “Some buyers are trying to get ahead of further rate increases,” said Denise Mazone, President of Minneapolis Area REALTORS®. “But the truth is that equity gains over time are likely to outpace the slightly higher payments.” Listings spent 10.3 percent fewer days on market than last March on average, after a 36.1 percent decline the year prior. But the median days on market showed a year-over-year increase for only the third time since September 2019. This could be a sign of a more balanced market. Yet sellers accepted offers 2.7 percent higher than their list price, on average.
HOME PRICES & INVENTORY
Home price are expected to continue rising given a chronically undersupplied market with strong demand, but perhaps at a lesser rate. The median price rose 7.5 percent to $353,000; the average price rose 7.0 percent to $409,754—both record highs. On average, buyers are spending about $200 per square foot. The Twin Cities presently has about four week’s supply of inventory (0.9 months), while a balanced market has roughly four to six months’ supply. But over a decade of underbuilding has meant steep competition for most listings. That coincides with a huge Millennial generation aging into prime homeownership years, not to mention the desire for more space for working and learning from home. Even though inventory levels were down, there are signs that supply is beginning to stabilize. “While inventory levels remain low, there are listings that come on market and go under contract quickly that don’t always show up in the month-end inventory count,” according to Mark Mason, President of the Saint Paul Area Association of REALTORS®.
LOCATION & PROPERTY TYPE
Market activity varies by area, price point and property type. New home sales rose 1.4 percent compared to a 10.5 percent dip for previously owned homes. Single family sales fell 9.3 percent while condo sales were down 5.3 percent. Sales in Minneapolis declined 8.8 percent while Saint Paul sales were down 18.2 percent. Hastings, Hugo and Lino Lakes saw the greatest increase in closed sales while Prior Lake, Richfield and Minnetonka saw sales fall by 35.0 percent or more.
MARCH 2022 BY THE NUMBERS (COMPARED TO A YEAR AGO)
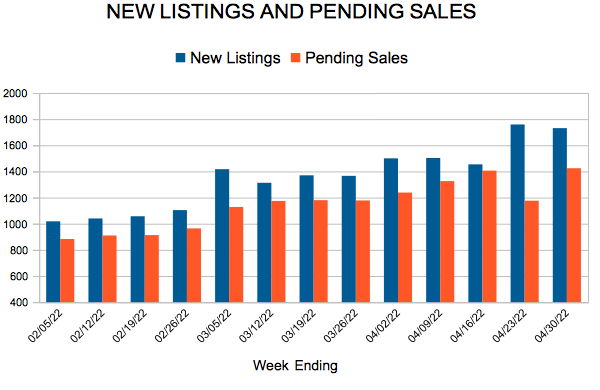
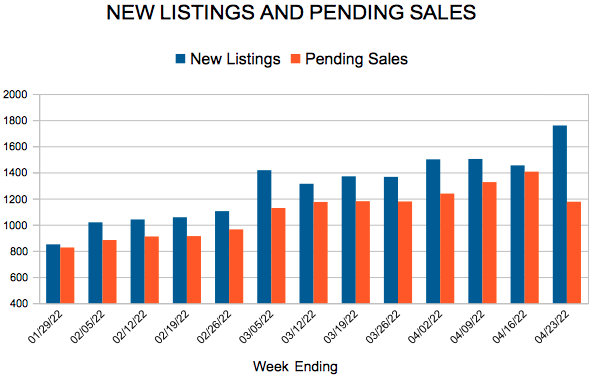
MARCH 2022 HOUSING CHARTS
From The Skinny Blog.
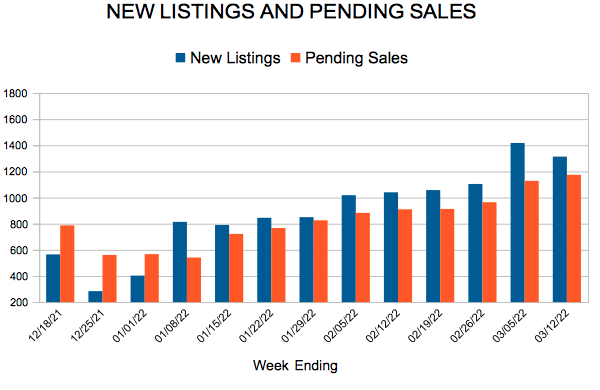
(March 15, 2022) – According to new data from Minneapolis Area REALTORS® and the Saint Paul Area Association of REALTORS®, buyer activity in the Twin Cities metro showed its first month-over-month gain since August 2021. As the Covid reshuffle continues to temper, sales are down compared to February of 2020 and 2021, but up from 2019 levels.
LISTINGS & SALES
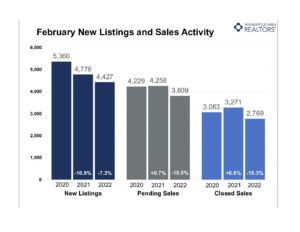
Buyers signed 10.5 percent fewer purchase agreements than last year and closed on 15.3 percent fewer homes. Since 2020, seller activity has remained especially sluggish—the 4,427 new listings are 18.2 percent fewer than February 2020. While the seasonal uptick toward spring market has begun, it may prove challenging to match activity levels from the prior two years, as the pandemic and the prospect of rising rates shifted activity up from 2022 and 2023 into 2020 and 2021 to accommodate working and learning from home.
“Homes sold more quickly last month than they did last February, and prices rose over 8.0 percent,” said Denise Mazone, President of Minneapolis Area REALTORS®. “While we may not reach the heights of 2020 and 2021, the market remains competitive, homes are still selling rapidly often with multiple bids, and buyers and sellers need to be prepared to move quickly.” Market times have been falling for years, but today’s listings spend even less time on the market. Two years ago, half of the listings went under contract in under 40 days, but last month, half of the listings spent fewer than 19 days on the market. That’s more than a 52.0 percent drop.
HOME PRICES & INVENTORY
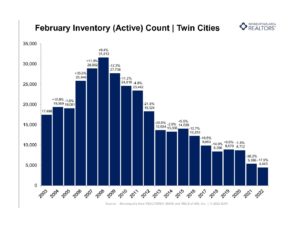
The median sales price in the Twin Cities rose 8.3 percent from last February to $340,000. That’s exactly half the 16.6 percent year-over-year rate of price growth seen in May 2021. Rising prices are expected to continue in a persistently undersupplied market with historically strong demand. The Twin Cities presently has about three week’s supply of inventory (0.8 months), where a balanced market would supply four to six months’ worth of homes given recent demand.
Inventory levels dipped 19.0 percent from this time last year. Compounded with a 38.2 percent fall from 2020 to 2021, the metro is facing an inventory shortage that should keep prices strong, market times fast, multiple offers fairly commonplace and some sellers getting above asking price. “Homeowners have gained significant equity, particularly over the last few years,” according to Mark Mason, President of the Saint Paul Area Association of REALTORS®. “Having a knowledgeable advisor to navigate a fast and complex process can help buyers be more competitive and successful.”
LOCATION & PROPERTY TYPE
Market activity varies by area, price point and property type. New construction sales fell 15.5 percent compared to only a 12.2 percent dip in sales of previously owned homes. Single family sales tumbled 9.8 percent while condo sales were down an even 10.0 percent. Between Minneapolis and St. Paul, the latter took the harder hit in sales losses. Saint Paul’s sales were 24.8 percent down compared to Minneapolis’ loss of 15.1 percent. Hastings, Delano and Rush City all had more than double the sales from last year while Hugo, Little Canada and East Bloomington weren’t far behind. Sales fell by around 50.0 percent in Prior Lake, New Hope, Big Lake and Golden Valley.
February 2022 by the numbers compared to a year ago
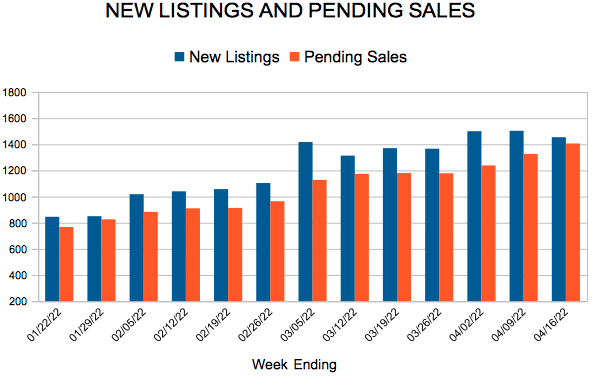
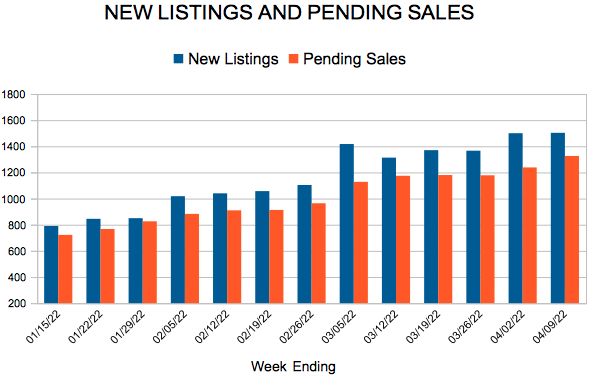
February 2022 housing charts
From The Skinny Blog.

Licensed In Minnesota
All information deemed reliable but not guaranteed and should be independently verified.